There’s a mystery at the fringes of our towns and cities: beyond the concrete circulars and just off the dual carriageways, a seemingly growing amount of our stuff is collecting dust in purpose-built warehouses. The puzzle is why so many self-storage units have sprung up across the UK and what people are storing in them that they need so very rarely.
I should be clear: I don’t know if the number has increased or not. It just seems like their numbers have increased, and others have noticed this and remarked upon it to me too (I have some pretty thrilling conversations with data scientists and economists). It was ONS Fellow Professor Stuart McIntyre who first asked me the question and I’ve been thinking about it since.
You may, by now, be wondering why you should care. This isn’t just about an interesting phenomenon with self-storage units, though that does seem worth exploring. What it’s really about is what we can find out about the local sites of firms. This could be a single, independent chippy, the site of a chain restaurant, or, indeed, an outpost of a self-storage firm. In short, lots of entities that people do care about.
So I thought it would be fun to at least look at what data are available to estimate the number of these self-storage units and whether it’s changing over time.
Hypotheses
Although this post is more about the how, it’s fun to think a little bit about the ‘why?’ too.
In films, books, and television, storage units are shady places where murderers keep their grisly trophies or international criminal gangs stash ill-gotten gains. In practice, they’re likely to be a place to dump furniture that there’s no space for, and this suggests a few explanations.
Maybe the falling cost of budget furniture is partly behind the rise in storage units or perhaps it’s our ageing population that, sadly, often means clearing out the houses of elderly relatives after they are gone (but which their descendants can’t quite bear to part with). Of course, house prices are high so using storage may be cheaper than having a bigger home, but it’s a lot less convenient if you need something. You can imagine people converting their garages to extra bedrooms and stashing their junkier items in storage.
Having said that there could be economic reasons, these units are expensive! The price for 35 sq ft (3.5 square metres) in a self-storage place in Croydon is around £37 a week. You have to really care about that stuff to pay that much to keep it. At a time when most people are cutting back, it seems strange to spend so much on just keeping some stuff that is rarely used.
Another potential explanation is that the market for second-hand goods has become deeper, so there’s more storage needed not in homes to park it while it’s waiting to be transacted.
There are lots of possible economic hypotheses behind the rise of self-storage, but for now what we want data to tell us whether or not this anecdotal effect is real or not.
Data
‘“Data! Data! Data!”, he cried impatiently. “I can’t make bricks without clay.”’
—Sherlock Holmes
Before you get too excited, there isn’t a killer data source here that I’m aware of. And it’s complicated by needing a time series rather than simply a cross-section, which means we need historical data. There are a range of different possible options we could pursue to try to get a handle on this:
- Open Street Map data
- UK firm-site level data, eg from the Interdepartmental Business Database
- Using the Google Maps API to count sites
- Scraping the websites of the main self-storage firms
Let’s look at each of these strategies in turn.
Open Street Map data
So we’re going to use the crowd-sourced Open Street Map data to try to answer this question. It has a number of caveats: it’s only updated (items added or deleted) when a member of the public decides to update it. So it may not give a totally accurate picture of what’s going on, but it’s a fantastic resource nonetheless because it aspires to be comprehensive and consistent in its tags. While it may not give a perfect count of what’s out there, you hope that it might track it.
We will use the Open Street Map Overpass Turbo API to do a query on all self-storage units in the UK. The query can be run here.
[out:json];
area["ISO3166-1"="GB"]->.uk;
(
node["shop"="storage_rental"](area.uk);
way["shop"="storage_rental"](area.uk);
relation["shop"="storage_rental"](area.uk);
);
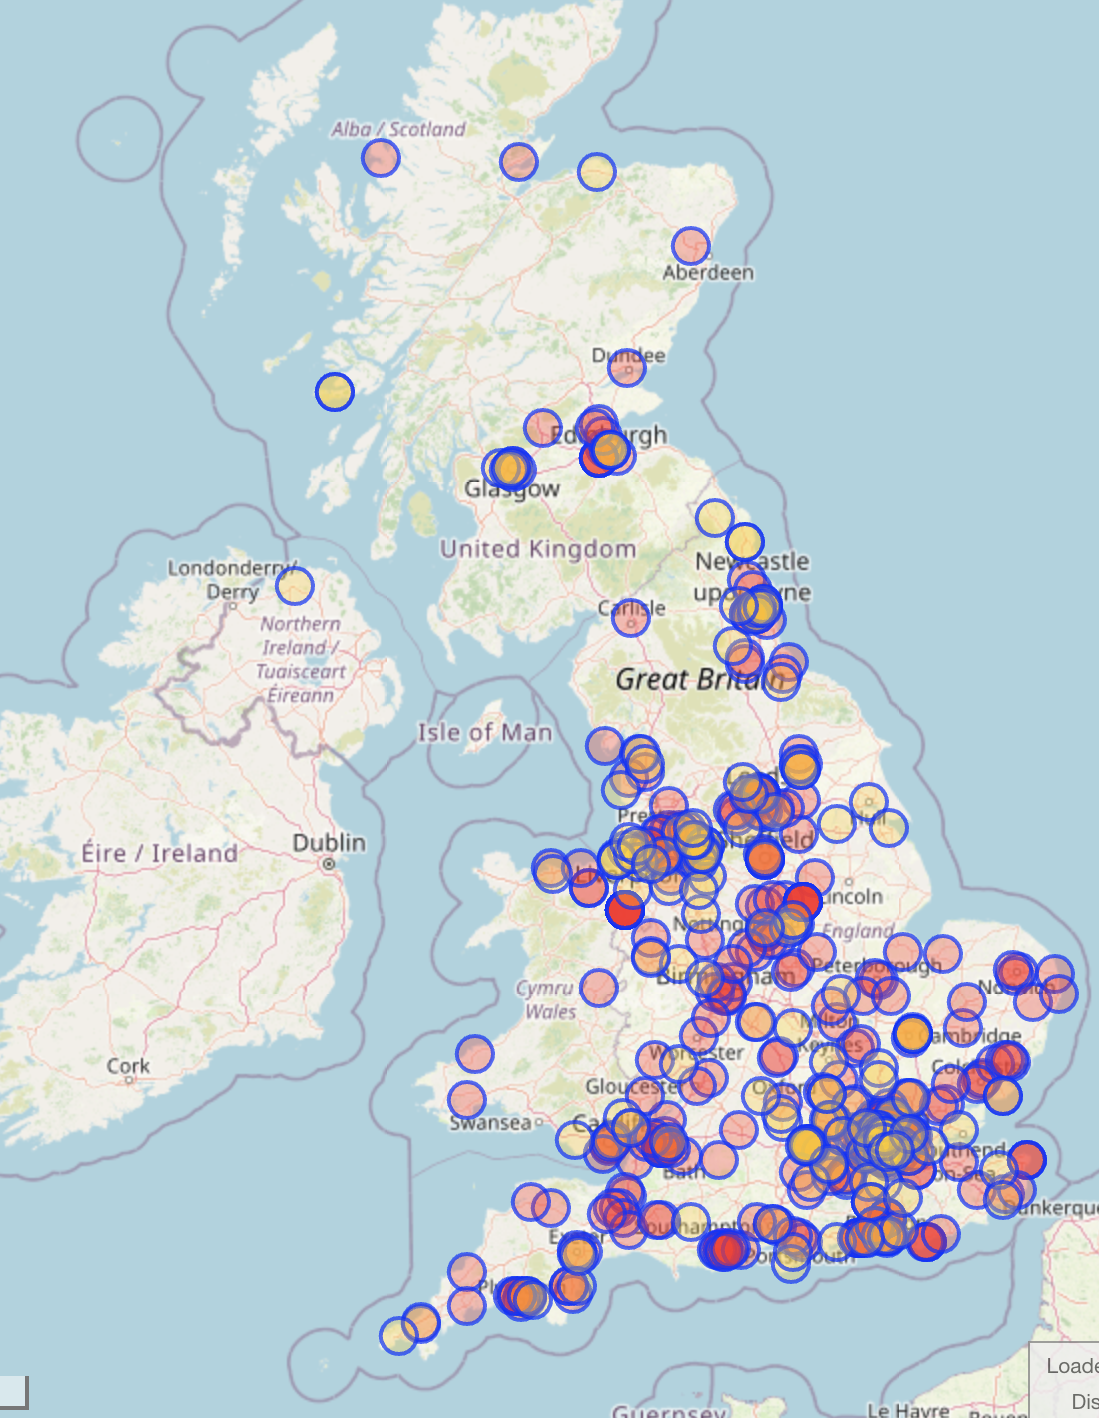
out center;In the interactive API, this produces a nice map of all ways and nodes (two types of object defined by the underlying data structures of Open Street Map).
If you save the data to a GeoJSON file and open it with geopandas, you can then count up the number of instances using
df = gpd.read_file(Path("export.geojson"))
val_counts = df["name"].value_counts()
val_counts[val_counts>3]| name | |
|---|---|
| Big Yellow Self Storage | 40 |
| Safestore | 38 |
| Access Self Storage | 17 |
| Lok’nStore | 14 |
| UK Storage Company | 9 |
| Ready Steady Store | 6 |
| Storage King | 5 |
| Shurgard Self Storage | 5 |
| Safestore Self Storage | 4 |
Unfortunately, this just doesn’t check out with other information. We can check how many units Big Yellow actually have on their website, and it’s far more than 40 (the total is 107). Partly, this is about matching records. We can check this with
val_counts.index.str.contains("Yellow").sum()11This means that 11 rows had a mention of “Yellow” in, whereas we expect only a single row (with all counts). If we sum up these rows as a rough proxy of what the number should be:
val_counts.loc[val_counts.index.str.contains("Yellow")].sum()52We get 52, still far short of what we know the total is (assuming Big Yellow Self Storage’s website is up to date!)1
1 Safestore has 130 sites on its website, while OSM finds only 38, so this isn’t just a problem with Big Yellow Self-Storage.
Even if the numbers were correct, we don’t just need the number for today, we need it over time. This is an API query that, in principle, can help us understand the change since 2019 (when used in combination with the other data we already got).
[out:json];
area["ISO3166-1"="GB"]->.uk;
(
  node["shop"="storage_rental"](area.uk)(if: timestamp() <= "2018-12-01T00:00:00Z");
  way["shop"="storage_rental"](area.uk)(if: timestamp() <= "2018-12-01T00:00:00Z");
  relation["shop"="storage_rental"](area.uk)(if: timestamp() <= "2018-12-01T00:00:00Z");
);
out center;
Again, you can export the results to a GeoJSON file and open it with geopandas and then compare it:
df_time = gpd.read_file(Path("export_pre_2019.geojson"))
df_time["name"].value_counts().sum()
In this query, we find only 33 sites in total, and only one Big Yellow Self Storage site.
This doesn’t check out either: using the ever-awesome internet archive, we can dial the clock back to 25th Feb 2017 and lo and behold the website says:
a network of 89 storage facilities across London and the UK in high profile, easy–to–access location
Open Street Map is an amazing resource but, for this purpose, it just doesn’t have the information we’re looking for.2
2 A similar exercise for SafeStore shows 90 locations in 2011, and over 100 by 2016 but only one from OSM in 2017.
UK site-firm level data
The Inter-Departmental Business Register is an excellent within-government resource that does have some site-level information (but those who work on it note that there’s lots of pitfalls in using these data).3
3 ESCOE and ONS have done some great work trying to turn the IDBR into a longitudinal business database; check out the working paper here.
We could put in a request to the Office for National Statistics (ONS) to use the IDBR to produce the numbers of local units by firm but… they’d have to reject it! Even though you could walk down the street and see these units, and which firm they belong to, for yourself, it’s currently illegal for ONS to make firm-level data public even if it’s already in the public domain. The exact bit of legislation is outlined here:
Unfortunately, we are unable to provide the names of organisations operating within a particular sector of the economy. Under s.39 of the Statistics and Registration Service Act 2007, personal information held by us (including that which identifies a body corporate), must not be disclosed. Furthermore, under s.9 of the Statistics of Trade Act 1947, the disclosure of information relating to an individual undertaking, obtained for statistical purposes, is prohibited. As the release of this information is prohibited by law, s.44 of the Freedom of Information Act 2000 applies.
From a note about firm names on the ONS’ website
However, we could ask the ONS to aggregate the number of local units by the relevant SIC code and year and publish that. But we would need to be confident that these firms are i) represented by one SIC code and ii) all have accurate SIC codes. Looking at a couple of firms on Companies House, I can see that one (Big Yellow) has SIC code “64306 - Activities of real estate investment trusts” while another, Safestore, has “68209 - Other letting and operating of own or leased real estate”, and another has “68320 - Management of real estate on a fee or contract basis” which makes me think there are problems on both fronts. None of them even have the same 4-digit SIC codes!
If we were feeling bold, we might decide that existing data on Business Activity, Size, and Location for one or more of these SIC codes could help us by acting as a proxy, but this dragnet approach would surely pull in lots of other kinds of business too. Furthermore, the data are available in separate Microsoft Excel files by year with empty cells and inconsistent formatting, so we’d have to spend some time writing code to extract the data in a consistent pattern. All not very satisfying.
Overall, it seems like official data aren’t going to be massively helpful here.
Google Maps
Google Maps holds some promise. A quick search using the browser-based map shows me that there is a category called “self-storage facility”. If we could use the API version to get results for all of the UK, we might be onto a winner.
However, time is important in this question and (after checking with a Googler) there is no time dimension for Maps, it exists only in the present. Which is a shame because people would undoubtedly pay for snapshots in time and we could do a lot of interesting social analysis with it.
When you’re not looking for a time series dimension though, Google Maps could be a great choice.
Scraping the websites of the self-storage firms
In this approach, we would scrape the websites of the self-storage firms to get information on their physical sites. This option has legs; so much so that we used it to validate our attempt to get these data from OSM. It works.4 The problem is that it requires us to scrape all of the websites of the self-storage firms and to also scrape their historical websites too (via the internet archive). That’s possible, but quite hard work, as my guess is that each firm-time combination will need a bespoke scraping solution.
4 Some data firms, such as Glass.AI, have specialised in firm website data so they may have some better ideas as to how to do this.
There is one big limitation beyond needing bespoke scrapers: the internet archive doesn’t get all of a website, and so might be missing the key pages / information, especially if we rely on tricks like grabbing the address only.
That aside, how might you go about getting this data using a scraper? Each location probably has a full address somewhere, so we could just scrape the entire website and use some kind of NLP to grab locations and hope that what gets picked up corresponds to the sites that are offered. There’d be some errors, like recording their primary office, but if you kept the page that the addresses were scraped from you could do something like eliminate any pages with just a single address.
To put rocket boosters on this approach, you could use a large language model (LLM). A new feature just introduced by OpenAI, called function calling, makes this possible: essentially, it allows you to generate structured output from an LLM—think a JSON file—by defining a schema of data fields you’d like and then feeding it the text to find those fields. There’s a great prototype gist here that shows how to send an LLM a Washington Post article about a shooting and get it to extract salient information according to a schema. As it’s short, I’m including the code below. Note that not only is the schema defined, but there is a short description of each field too.
import openai
import json
import requests
from bs4 import BeautifulSoup
url = 'https://www.lapdonline.org/newsroom/officer-involved-shooting-in-hollywood-area-nrf059-18ma/'
html = requests.get(url).content
soup = BeautifulSoup(html).find('div', class_='detail-cms-content')
text = soup.text.strip()
functions = [
    {
        "name": "extract_data",
        "description": "Add the summary of a newsroom article to the database.",
        "parameters": {
            "type": "object",
                "properties": {
                    "date": {
                        "type": "string",
                        "format": "date"
                    },
                    "violent": {
                        "type": "boolean",
                        "description": "Does this describe a violent incident?"
                    },
                    "fatal": {
                        "type": "boolean",
                        "description": "Does this describe a fatal incident?"
                    },
                    "in_custody": {
                        "type": "boolean",
                        "description": "Did this happen in custody?"
                    },
                    "unintentional_discharge": {
                        "type": "boolean",
                        "description": "Was this an unintentional discharge?"
                    },
                    "injured": {
                        "type": "array",
                        "items": {
                            "type": "string"
                        },
                        "description": "What are the names of the people who were injured, if any?"
                    },
                    "deceased": {
                        "type": "array",
                        "items": {
                            "type": "string"
                        },
                        "description": "What are the names of the people who are deceased, if any?"
                    },
                    "serials": {
                        "type": "array",
                        "items": {
                                "type": "number"
                        },
                        "description": "What are the serial numbers of the officers involved?"
                    }
                },
            "required": ["date", "violent", "fatal", "in_custody", "unintentional_discharge", "injured", "deceased", "serials"],
        },
    }
]

messages = [
    {"role": "system", "content": "You are a helpful assistant that extracts summaries of LAPD newsroom articles as JSON for a database."},
    {"role": "user", "content": 'Extract a summary from the following article: ' + text}
]

response = openai.ChatCompletion.create(
    model='gpt-3.5-turbo-0613', functions=functions, messages=messages)

print(response.choices[0]['message']['function_call']['arguments'])
And the output? Well, it’s quite magical:
{
  "date": "October 29, 2018",
  "violent": true,
  "fatal": true,
  "in_custody": false,
  "unintentional_discharge": false,
  "injured": ["Officer Edward Agdeppa"],
  "deceased": ["Albert Ramon Dorsey"],
  "serials": [41000]
}
This sort of approach could really work! There would be some more legwork involved in grabbing the URLs (past and present) of the biggest self-storage firms but that doesn’t seem insurmountable because the internet archive is well structured.
Conclusion
We’ve looked at four possible ways to answer how the number of self-storage facilities in the UK is changing over time. What’s amazing is that this information, which anyone could find out by driving round the country a bit, is so hard to get at. While self-storage facilities happened to be the topic of interest, the same applies to lots of other data that could be used to answer 100s of questions of relevance to the UK, so having ways to do this seems important.
In this example, only one route seems feasible: scraping firm websites with the help of the excellent internet archive and either a lot of manual graft or a highly experimental using a large language model!
Maybe I missed a way to get hold of this data? I’ll update the post if you can tell me other strategies. As for the LLM-approach we’ve found, I’m tempted to try it, and maybe you are too? Let me know!