Guide to the data
How to use the data archive
This page is a guide to what’s in the archive. It covers what the data consist of, where they came from, the choices made in assembling them, and checks on them.
Terms
- Vintage date: the date a value was published.
- Reference period: the period a value describes, such as 2024 Q1 or March 2024. It is a proper period, not a timestamp.
- Change-only storage: a row is kept only when a value is first published or later revised. Any past vintage can be rebuilt from these rows.
- CDID: the four-character ONS code for a single time series, for example
ABMIfor GDP.
The data
The archive consists of a single table in parquet format. Each row gives a single economic value, its reference period (the time the number describes, such as a particular quarter or month), and the vintage date (the day the number was published), plus other meta-data.
A row appears only when there is new information. If a number is republished unchanged, no row is added. You can still rebuild the figures as they stood on any date, because the most recent row on or before that date is the figure that was then in force. (ALFRED, the St. Louis Fed’s archive of US data, stores its data the same way.)
194
series
294,559
rows
1,563
distinct publication dates
Sep 1961
earliest publication
Nov 2026
latest publication
Of the rows, 20,238 are first estimates, 252,141 are revisions, and 22,180 are old figures that the archive first saw long after the period ended. Those last ones are labelled history and should not be treated as first estimates.
What the data cover
GDP and its components, output by industry, prices, the labour market, trade, and household and government finances, along with 129 results from four business surveys. Most official series come from the Office for National Statistics (ONS), the UK’s national statistics office, and have a CDID, which is ONS’s four-character code for a time series (ABMI is GDP, for example). Where ONS publishes a growth-rate table with no code of its own, the archive uses a label based on the matching code, such as IOS_MOM for monthly growth in services. Survey series have codes of our own, such as DMP_SALES_REALISED_MEAN.
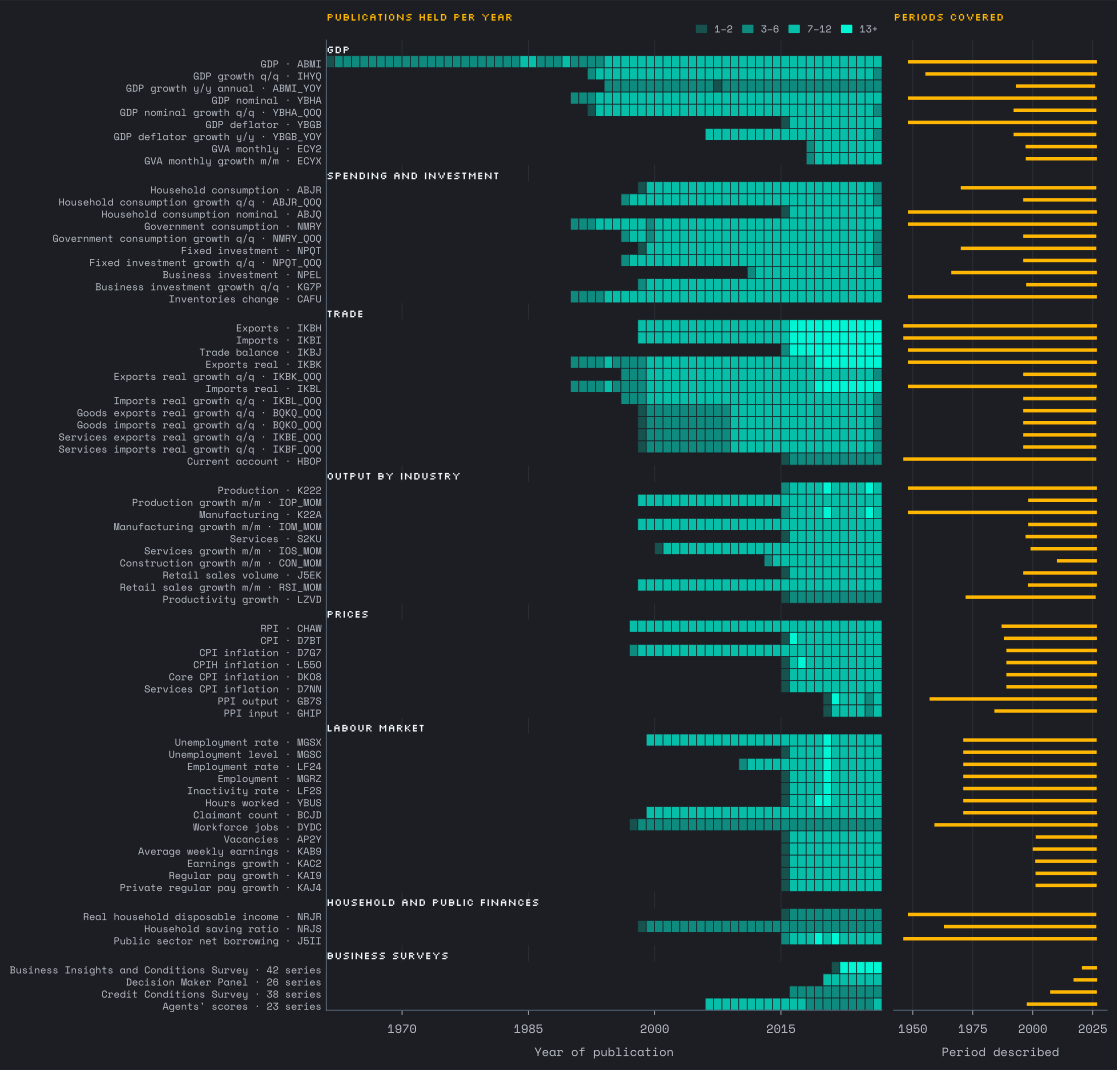
How to read Figure 1:
- Depth varies a lot between series. GDP is held back to 1961. 32 series have publications from before 2000. 28 official series start in 2015 or later. Most of these rely on the ONS website’s own page history, which begins around then, and a few only began being published later (monthly GDP dates from 2018).
- A step up from September 2015. The band of publications thickens sharply from that point, because that is when the page histories begin.
- Periods described reach further back than publications. A table published in 2015 can include figures for 1946. The left panel shows when the archive knows something was said, and the right panel shows what it was said about.
A single series can hold annual, quarterly and monthly figures at once, as ONS often publishes all three under one code. The frequency column separates them, so filter on it before comparing values. Rolling three-month labour market figures are marked in the reference_period_basis column and stored against the month the window ends.
Many indicators appear twice, once as a level (ABMI, GDP in pounds) and once as a growth rate (IHYQ, GDP growth on the previous quarter). The two forms come from different ONS products and are kept apart on purpose.
Where these data come from
The figures come from files published by ONS and the Bank of England, gathered by 8 routes. The source column names the publisher and the route column names the route:
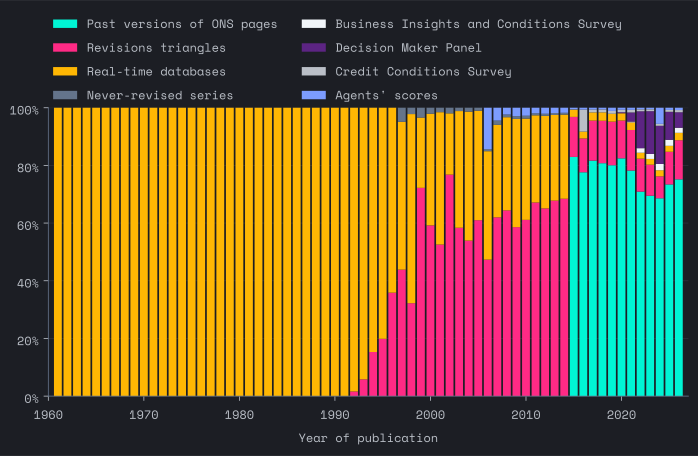
- Past versions of ONS web pages. ONS keeps every version of each series’ page. These give exact publication dates, but mostly only from September 2015. Example: GDP.
- Revisions triangles. These are ONS spreadsheets that lay out each estimate of a period as it was revised, row by row. They often reach back well before the page histories but record only the publication month. Example: GDP revisions triangle.
- Real-time databases. These are ONS spreadsheets holding each published version of GDP and its main expenditure components, by month. GDP goes back to 1961. Example: GDP real-time database.
- Never-revised series. ONS does not revise some price measures, such as the Retail Prices Index, so today’s figure is also the first one published. Example: Retail Prices Index.
- Business surveys. The Business Insights and Conditions Survey comes from ONS. The Decision Maker Panel, the Credit Conditions Survey and the Agents’ scores come from the Bank of England. The first three publish a new file for each release, so each file is a true vintage. The Agents’ scores come as a single file, so their dates are estimated from the Bank’s report dates. Example: Decision Maker Panel.
Figure 2 shows that 60% of rows come from page histories and 66% of rows are dated to the exact day. Each row records its source file, that file’s fingerprint (a hash, which changes if the contents change) and when it was downloaded. Each raw file is kept, so the table can be rebuilt without going back to the publishers.
Judgements made in assembling the data
These are the choices most likely to affect your results.
If vintage is uncertain, we err on the late side. Dates must never suggest a figure was known before it was. Older sources give only a publication month, so those rows are dated to the last day of that month. A model using the archive may therefore see an old figure a few weeks after it came out, but we aim to to prevent it from appearing before it came out in reality. The vintage_date_precision column says how each date was arrived at: day for exact, month for the end of the known month, and upper_bound for the latest date it could have been.
Dating gets sharper from September 2015. Before then, nearly all dates are month-ends. Afterwards, most are exact. This is due to how ONS makes revisions and vintages available.
One source at a time. When sources overlap, the one with the most exact dates is preferred. Page histories rank first, then triangles and never-revised series, then real-time databases.
Rounding differences are not revisions. Two sources may give the same number to different decimal places. Values filling a gap are rounded to match the series’ main source, so a change in rounding does not show up as a false revision.
Old figures are labelled as old. When a period first appears in the archive more than a year after it ended, no source reaches back to its real first estimate. Such rows are marked history. For example, GDP growth for 1955 to 1991 first appears in a table from May 2015. To study first estimates only, use the rows labelled first.
Never-revised series are filled in backwards. Before September 2015, CPI inflation and RPI come from today’s figures, each dated to the end of the month after the month it describes. That is later than the true release, but never earlier.
Numbers are kept as published. No rebasing, smoothing or correcting has been done. Levels therefore change units every few years, as ONS moves its figures to the prices of a new reference year, and the oldest GDP vintages are in the prices of much earlier years. Compare levels only within a single vintage.
Growth rates are better for testing models. Because levels change units, the published growth rates are more consistent through time. Which series to use lists a recommended series for each main indicator.
An example: UK GDP and its revisions
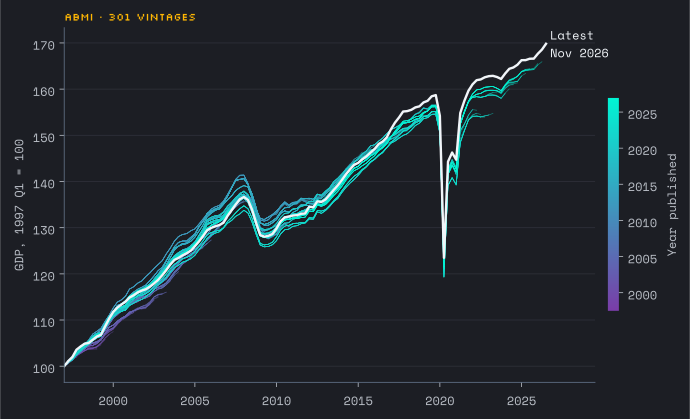
The lines start together at 100 and spread apart as ONS gathers fuller information and improves its methods. The spread is the reason for keeping every vintage: someone looking at GDP years ago saw a different past from someone looking today.
Single quarters show the same thing. ONS first estimated growth in the fourth quarter of 2008 at −1.5% in January 2009. The archive holds 12 changes to that figure since then, and it now stands at −2.1%. Growth in the second quarter of 2020 was first put at −20.4% on 12 August 2020, has changed 9 times, and now stands at −19.9%.
This chart uses the levels series, indexed within each vintage, because levels show how the whole path shifted.
Are these data and their vintages likely to be correct?
Values could be incorrect, or publication dates, or both. In this section, we show several tests that try to verify the accuracy of the values and the vintages. (Of course, this doesn’t address other issues, like measurement error!)
Comparison with an independent archive
The OECD has kept its own record of UK statistics, one edition a month since February 1999, shown in Figure 4. These data are independent of the archive. Each comparison takes the most recent periods in each OECD edition, works out growth rates and checks them against the archive around the same date. That covers 40,107 comparisons on 13 of the archive’s 194 series, across up to 333 editions. These results were last worked out on 2 November 2026.
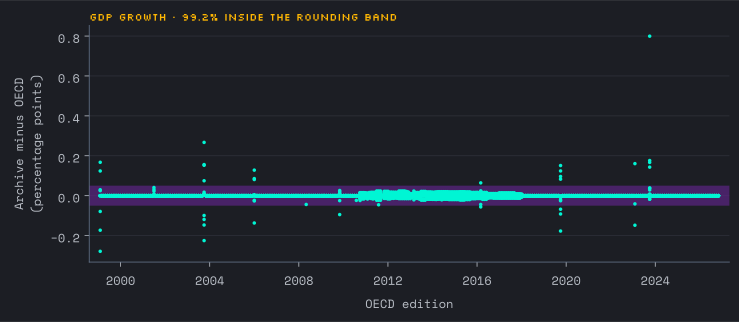
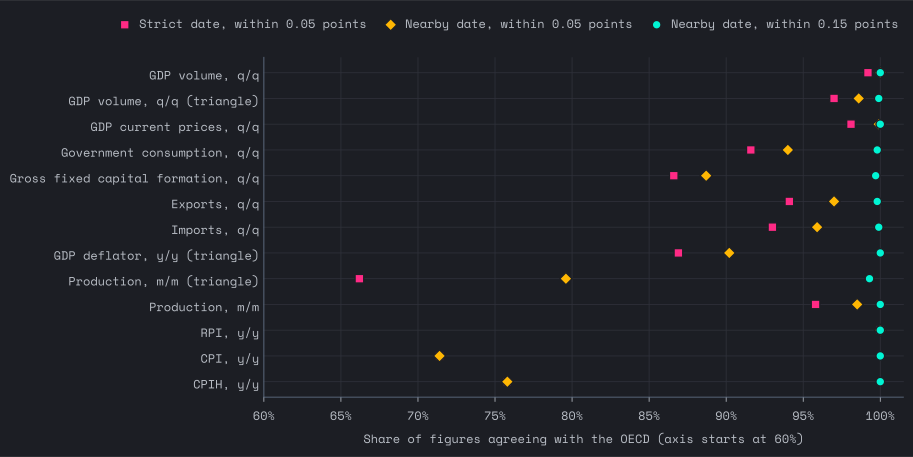
Under the looser test, at least 99.3% of figures agree in every comparison. The tighter tests performs less well, but there are two reasons that this may be the case. First, the OECD rebases ONS’s one-decimal indices, so growth worked out from them can sit a little away from the rate ONS published, even for the same release. That accounts for much of the gap in production and in consumer prices. Second, the OECD may have collected a release at a different point from where the test looks.
Unemployment and retail sales are not compared, because the OECD’s UK series are different measures from the ONS ones held here. Most other series have no outside check of this kind.
Comparison with itself
ONS publishes some series both as levels and as growth rates, and the archive often gets them by different routes. At each vintage, growth worked out from the levels should match the published growth rate. A mismatch would point to a misread or misdated file.
| Growth and level series | Figures compared | Within rounding | Within 0.15 points | Largest gap |
|---|---|---|---|---|
IHYQ and ABMI |
34,265 | 98.2% | 99.3% | 0.47 points: 1998Q1 as of 1998-05-31 |
YBHA_QOQ and YBHA |
18,990 | 99.9% | 100.0% | 0.34 points: 2004Q1 as of 2005-03-31 |
ABJR_QOQ and ABJR |
14,589 | 99.8% | 99.9% | 0.53 points: 1998Q4 as of 1999-06-30 |
NPQT_QOQ and NPQT |
14,744 | 99.7% | 99.8% | 5.46 points: 2002Q2 as of 2002-08-31 |
NMRY_QOQ and NMRY |
14,844 | 99.9% | 100.0% | 1.69 points: 1997Q1 as of 1999-07-31 |
IKBK_QOQ and IKBK |
14,714 | 99.7% | 99.9% | 1.11 points: 2021Q1 as of 2021-08-31 |
IKBL_QOQ and IKBL |
14,816 | 99.7% | 99.8% | 0.48 points: 1998Q3 as of 1999-07-31 |
One of the largest gaps is the August 2002 typing error mentioned above, which sits in the published growth rate. Of the 7 largest gaps, 4 are in vintages from before 2000. The early GDP gaps remain unexplained (see the limits below).
Checks on dating
- Figures published before their period ended. A figure dated on or before the end of the period it describes would suggest a wrong date. 24 of 294,559 rows (0.008%) meet this test. 22 are annual workforce jobs figures that appear before their year is over, published that way on ONS’s page, so they do not look like dating errors. Surveys are left out of this test, because they can properly report on a month before it ends. The other 2 are production and manufacturing figures (for example, 2021Q3 published 2021-09-10), which have not been looked into further.
- First figures that arrive late. If a period appeared in the archive later than in one of the sources collected, a source would have been wrongly set aside. There were none when this was last checked, on 2 November 2026.
- Mixed definitions. A monthly series should not mix single months with rolling three-month windows. 0 series do.
Traceable values
The archive is put together by a program from stored copies of the published files, with no figures entered or changed by hand.
Known limits
See Data Issues for full details of the limitations of this archive.
Which series to use
Several indicators are held in more than one form. If you are testing a model on the data available at each date, choose the form that stays the same throughout your sample. In practice, that usually means the published growth rate.
| Indicator | Series | Publications from | Notes |
|---|---|---|---|
| GDP, quarter on quarter | IHYQ |
1992 | |
| GDP, month on month | ECYX |
2018 | Monthly GDP was first published in July 2018 |
| Nominal GDP, quarter on quarter | YBHA_QOQ |
1992 | |
| GDP deflator, on a year ago | YBGB_YOY |
2006 | |
| Household consumption | ABJR_QOQ |
1996 | |
| Government consumption | NMRY_QOQ |
1996 | |
| Gross fixed capital formation | NPQT_QOQ |
1996 | The August 2002 vintage holds an ONS typing error |
| Business investment | KG7P |
1998 | |
| Exports (volume) | IKBK_QOQ |
1996 | |
| Imports (volume) | IKBL_QOQ |
1996 | |
| Production, month on month | IOP_MOM |
1998 | |
| Manufacturing, month on month | IOM_MOM |
1998 | |
| Services, month on month | IOS_MOM |
2000 | |
| Construction, month on month | CON_MOM |
2013 | |
| Retail sales volume, month on month | RSI_MOM |
1998 | Not checked against the OECD |
| CPI inflation | D7G7 |
1997 | Never revised, so earlier values are first publications |
| RPI | CHAW |
1997 | Never revised |
| Unemployment rate | MGSX |
1999 | Rolling three-month figures |
| Employment rate | LF24 |
2010 | Rolling three-month figures |
| Claimant count | BCJD |
1999 | |
| Household saving ratio | NRJS |
1998 |
What each column means
| Column | Meaning |
|---|---|
series_id |
The publisher’s code for the series, or a label of our own |
dataset_id |
The dataset or survey the value came from, such as QNA or DMP |
title, short_name, measure |
What the series is and its units |
frequency |
A annual, Q quarterly, M monthly or D daily, for survey waves |
reference_period |
The period the value describes |
reference_period_basis |
period, 3m_ending for rolling three-month figures, or survey |
vintage_date |
When the value was published |
vintage_date_precision |
day, month or upper_bound |
release_type |
first, revision or history |
value |
The published value |
source |
The publisher: ONS or Bank of England |
route, source_url |
The route and the exact file or web address |
retrieved_at, content_sha256 |
When the file was downloaded, and its fingerprint |