This chapter covers the tools and knowledge that will help you to write better code faster and to understand what’s going on when your code goes wrong! This includes practical topics such as debugging code, logging, linting, and the magic of auto-formatting. Some of the topics are a bit more advanced and come with a warning to tell you so.
As ever, you may need to conda install packagename or pip install packagename on the terminal before being able to use some of the packages that are featured.
Auto-magically improving your code
In the previous chapter, we met the idea of code style: even for code that runs, how you write it matters for readability. (And it goes without saying that you don’t want bugs in your code that stop it running at all.) It is possible to catch some errors, to flag style issues, and even to re-format code to comply with a code style automatically. In this section, we’ll see how to use tools to perform these functions automatically.
Linting
Linters are tools that analyse code for programmatic and stylistic errors, assuming you have declared a style. A linting tool flags any potential errors and deviations from style before you even run it. When you run a linter, you get a report of what line the issue is on and why it has been raised. They are supposedly named after the lint trap in a clothes dryer because of the way they catch small errors that could have big effects.
One of the most popular linters in Python is the blazingly-fast Ruff but you might also come across flake8, pycodestyle, and pylint.
Let’s see an example of running a linter. VS Code has direct integration with a range of linters. To get going, use ⇧⌘P (Mac) and then type ‘Python Select Linter’. In the example below, we’ll use flake8 (and pylance, another VS Code extension that you will likely have already). Let’s pretend we have a script, test.py, containing
list_defn = [1,5, 6,7]def this_is_a_func():print('hello')print(X)import numpy as np
To see the linting report, press ^ + ` (Mac) or ctrl + ` (otherwise) and navigate to the ‘Problems’ tab. We get a whole load of error messages about this script, here are a few:
ⓧ missing whitespace after ‘,’ flake8(E231) 1, 15
ⓧ continuation line under-indented for visual indent flake8(E128) 2, 1
ⓧ expected 2 blank lines, found 1 flake8(E302) 4, 1
ⓧ indentation is not a multiple of 4 flake8(E111) 5, 4
ⓧ undefined name ‘X’ flake8(F821) 7, 7
ⓧ module level import not at top of file flake8(E402) 9, 1
ⓧ ‘numpy as np’ imported but unused flake8(F3401) 9, 1
⚠ “X” is not defined Pylance(reportUndefinedVariable) 7, 7
⚠ no newline at end of file flake8(W292) 78, 338
each message is a warning or error that says what the problem is (for example, missing whitespace after ‘,’), what library is reporting it (mostly flake8 here), the name of the rule that has been broken (E231), and the line, row position (1, 15). Very helpfully, we get an undefined name message for variable X, this is especially handy because it would cause an error on execution otherwise. The same goes for the indentation message (indentation matters!). You can customise your linting settings in VS Code too.
Although the automatic linting offered by an IDE is very convenient, it’s not the only way to use linting tools. You can also run them from the command line. For example, for flake8, the command is flake8 test.py.
Formatting
It’s great to find out all the ways in which you are failing with respect to code style from a linter but wouldn’t it be even better if you could fix those style issues automatically? The answer is clearly yes! This is where formatters come in; they can take valid code and forcibly apply a code style to them. This is really handy in practice for all kinds of reasons.
The most popular code formatters in Python are probably: yapf, ‘yet another Python formatter’, from Google; autopep8, which applies PEP8 to your code; black, the ‘uncompromising formatter’ that is very opinionated (“any colour, as long as it’s black”); and Ruff.
There are two ways to use formatters, line-by-line (though black doesn’t work in this mode) or on an entire script at once. VS Code offers an integration with formatters. To select a formatter in VS Code, bring up the settings using ⌘ + , (Mac) or ctrl + , (otherwise) and type ‘python formatting provider’ and you can choose from autopep8, black, and yapf.
If you choose autopep8 and then open a script you can format a selection of code by pressing ⌘ + k, ⌘ + f (Mac) or ctrl + k, ctrl + f (otherwise). They can also (and only, in the case of black) be used from the command line. For instance, to use black, the command is black test.py, assuming you have it installed.
Let’s see an example of a poorly styled script and see what happens when we select all lines and use ctrl + k, ctrl + f to auto format with autopep8. The contents of test.py before formatting are:
def very_important_function(y_val,debug =False, keyword_arg=0, another_arg =2): X = np.linspace(0,10,5)return X+ y_val +keyword_argvery_important_function(2)list_defn = [1,2,3,5,6,7]import numpy as np
and, after running the auto-formatting command,
import numpy as npdef very_important_function(y_val, debug=False, keyword_arg=0, another_arg=2): X = np.linspace(0, 10, 5)return X + y_val + keyword_argvery_important_function(2)list_defn = [1,2,3,5,6,7]
So what did the formatter do? Many things. It moved the import to the top, put two blank lines after the function definition, removed whitespace around keyword arguments, added a new line at the end, and fixed some of the indentation. The different formatters have different strengths and weaknesses; for example, black is not so good at putting imports in the right place but excels at splitting up troublesome wide lines. If you need a formatter that deals specifically with module imports, check out isort or Ruff.
Apart from taking the pressure off you to always be thinking about code style, formatters can be useful when working collaboratively too. For some open source packages, maintainers ask that new code or changed code be run through a particular formatter if it is to be incorporated into the main branch. This helps ensure the code style is consistent regardless of who is writing it. Running the code formatter can even be automated to happen every time someone commits some code to a shared code repository too, using something called a pre-commit hook.
NB: Black can run on Jupyter Notebooks too: just install it with pip install "black[jupyter]" instead of pip install black.
Inspecting Variables
rich for beautiful inspection
rich is much more than just a tool for inspecting variables, it’s a way to create beautiful renderings of all objects both in the terminal and in interactive Python windows. You can use it to build fantastic looking command line interfaces. Here, we’ll see how it can help us find what value a variable takes and what methods can be used on a variable via its inspect() function.
from rich import inspectmy_list = ["foo", "bar"]inspect(my_list, methods=True)
╭───────────────────────────────────────── <class'list'> ──────────────────────────────────────────╮│Built-in mutable sequence.││││╭───────────────────────────────────────────────────────────────────────────────────────────────╮│││['foo', 'bar']│││╰───────────────────────────────────────────────────────────────────────────────────────────────╯││││append = def append(object, /): Append object to the end of the list.││clear = def clear(): Remove all items from list.││copy = def copy(): Return a shallow copy of the list.││count = def count(value, /): Return number of occurrences of value.││extend = def extend(iterable, /): Extend list by appending elements from the iterable.││index = def index(value, start=0, stop=9223372036854775807, /): Return first index of value.││insert = def insert(index, object, /): Insert object before index.││pop = def pop(index=-1, /): Remove and return item at index (default last).││remove = def remove(value, /): Remove first occurrence of value.││reverse = def reverse(): Reverse *IN PLACE*.││sort = def sort(*, key=None, reverse=False): Sort the list in ascending order and return None.│╰───────────────────────────────────────────────────────────────────────────────────────────────────╯
Check out all of the many options for inspect() using help(inspect). We ran it here with methods=True, but there are plenty of other options.
TipExercise
Create a dictionary (it doesn’t matter what’s in it, but you could map the integer 1 to the letter “a”). Then use inspect() with methods=True to find out about all the methods you can call on an object of type dict.
Errors and Exceptions
When a programme goes wrong, it throws up an error and halts. You won’t be coding for long before you hit one of these errors, which have special names depending on what triggered them.
Let’s see a real-life error in action:
denom =0print(1/denom)
---------------------------------------------------------------------------ZeroDivisionError Traceback (most recent call last)<ipython-input-39-e45c0e0a3e37>in<module>1 denom =02---->3print(1/denom)ZeroDivisionError: division by zero
Oh no! We got a ZeroDivisionError and our programme crashed. Note that the error includes a ‘Traceback’ to show which line went wrong, which is helpful for debugging.
In practice, there are often times when we know that an error could arise, and we would like to specify what should happen when it does (rather than having the programme crash).
We can use exceptions to do this. These come in a try … except pattern, which looks like an if … else pattern but applies to errors. If no errors occur inside the try block, the except block isn’t run but if something goes wrong inside the try then the except block is executed. Let’s see an example:
for denom in [-5, 0, 5]:try: result =1/ denomprint(f"1/{denom} == {result}")exceptZeroDivisionError:print(f"Cannot divide by {denom}")
1/-5 == -0.2
Cannot divide by 0
1/5 == 0.2
Now we can see two differences. First: the code executed just fine without halting. Second: when we hit the error, the except block was executed and told us what was going on. Note that we could have just used except in the above but it’s best practice, where you can, to use one of the built-in error keywords that Python comes with.
For error messages, it’s convenient to use Python’s built in messages whenever you can—the more specific, the better. You can see that in the case above we used ZeroDivisionError, which is pretty specific.
If you do need to use a generic error, use an informative message to help the user understand what’s going on:
for denom in [-5, 0, 5]:try: result =1/ denomprint(f"1/{denom} == {result}")exceptExceptionas error:print(f"{denom} has no reciprocal; error is: {error}")
1/-5 == -0.2
0 has no reciprocal; error is: division by zero
1/5 == 0.2
Sadly, division by zero is just one of the many errors you might encounter. What if a function is likely to end up running into several different errors? We can have multiple except clauses to catch these:
numbers = [-5, 0, 5]for i in [0, 1, 2, 3]:try: denom = numbers[i] result =1/ denomprint(f"1/{denom} == {result}")exceptIndexErroras error:print(f"index {i} out of range; error is {error}")exceptZeroDivisionErroras error:print(f"{denom} has no reciprocal; error is: {error}")
1/-5 == -0.2
0 has no reciprocal; error is: division by zero
1/5 == 0.2
index 3 out of range; error is list index out of range
A full list of built-in errors may be found here and they are nested in classes (eg ZeroDivisionError is a special case of a ArithmeticError).
Where do these errors come from anyway? What tells the programming language to throw a tantrum when it encounters certain combinations of values and operations.
The answer is that the person or people who wrote the code that’s ‘under the hood’ can specify when such errors should be raised. Remember, the philosophy of Python is that things should fail loudly (so that they do not cause issues downstream). Here’s an example of some code that raises its own errors using the raise keyword:
for number in [1, 0, -1]:try:if number <0:raiseValueError(f"no negatives: {number}")print(number)exceptValueErroras error:print(f"exception: {error}")
1
0
exception: no negatives: -1
A ValueError is a built-in type of error and there are plenty of ones to choose from for your case. Some big or specialised libraries define their own types of error too.
One very clever feature of Python’s exception handling is “throw low, catch high”, which means that even if an error gets thrown way deep down in the middle of a code block, the catching exception can be used some way away. Here’s an example: the error arises within the sum_reciprocals() function, but is caught elsewhere.
def sum_reciprocals(values): result =0for v in values: result +=1/ vreturn resultnumbers = [-1, 0, 1]try: one_over = sum_reciprocals(numbers)exceptArithmeticErroras error:print(f"Error trying to sum reciprocals: {error}")
Error trying to sum reciprocals: division by zero
Here’s an example of combining a try, several except statements, an else that gets executed if try is, and a finally that always get executed.
import datetimeb_year =1852name_input ="Ada"def process_input(name_input, b_year):try: name =str(name_input) year_born =int(b_year) age = datetime.datetime.now().year -int(year_born)print(f"You are {name}. And your age is {age}.")exceptTypeError:print("Type error occur")exceptValueError:print("Value error occur")exceptZeroDivisionError:print("zero division error occur")else:print("I usually run with the try block")finally:print("I always run.")process_input(name_input, b_year)
You are Ada. And your age is 174.
I usually run with the try block
I always run.
Debugging Code
Computers are very literal, so literal that unless you’re perfectly precise about what you want, they will end up doing something different. When that happens, one of the most difficult issues in programming is to understand why the code isn’t doing what you expected. When the code doesn’t do what we expect, it’s called a bug.
Bugs could be fundamental issues with the code you’re using (in fact, the term originated because a moth causing a problem in an early computer) and, if you find one of these, you should file an issue with the maintainers of the code. However, what’s much more likely is that the instructions you gave aren’t quite what is needed to produce the outcome that you want. And, in this case, you might need to debug the code: to find out which part of it isn’t doing what you expect.
Even with a small code base, it can be tricky to track down where the bug is: but don’t fear, there are tools on hand to help you find where the bug is.
Print statements
The simplest, and I’m afraid to say the most common, way to debug code is to plonk print statements in the code. Let’s take a common example in which we perform some simple array operations, here multiplying an array and then summing it with another array:
---------------------------------------------------------------------------UFuncTypeError Traceback (most recent call last)<ipython-input-1-166160824d19>in<module>11 in_vals_two = np.array([4, 7, 3, 23, 6, 8, 0])12--->13 result = array_operations(in_vals_one, in_vals_two)14 result<ipython-input-1-166160824d19>in array_operations(in_arr_one, in_arr_two)34def array_operations(in_arr_one, in_arr_two):---->5 out_arr = in_arr_one*1.56 out_arr = out_arr + in_arr_two7return out_arrUFuncTypeError: ufunc 'multiply' did not contain a loop with signature matching types (dtype('<U32'), dtype('<U32')) -> dtype('<U32')
Oh no! We’ve got a UFuncTypeError here, perhaps not the most illuminating error message we’ve ever seen. We’d like to know what’s going wrong here. The Traceback did give us a hint about where the issue occurred though; it happens in the multiplication line of the function we wrote.
To debug the error with print statements, we might re-run the code like this:
---------------------------------------------------------------------------UFuncTypeError Traceback (most recent call last)<ipython-input-2-6a04719bc0ff>in<module>9 in_vals_two = np.array([4, 7, 3, 23, 6, 8, 0])10--->11 result = array_operations(in_vals_one, in_vals_two)12 result<ipython-input-2-6a04719bc0ff>in array_operations(in_arr_one, in_arr_two)1def array_operations(in_arr_one, in_arr_two):2print(f'in_arr_one is {in_arr_one}')---->3 out_arr = in_arr_one*1.54 out_arr = out_arr + in_arr_two5return out_arrUFuncTypeError: ufunc 'multiply' did not contain a loop with signature matching types (dtype('<U32'), dtype('<U32')) -> dtype('<U32')
What can we tell from the values of in_arr_one that are now being printed? Well, they seem to have quote marks around them and what that means is that they’re strings, not floating point numbers or integers! Multiplying a string by 1.5 doesn’t make sense here, so that’s our error. If we did this, we might then trace the origin of that array back to find out where it was defined and see that instead of np.array([3, 2, 5, 16, 7, 8, 9, 22]) being declared, we have np.array([3, 2, 5, 16, '7', 8, 9, 22]) instead and numpy decides to cast the whole array as a string to ensure consistency.
Let’s fix that problem by turning '7' into 7 and run it again:
---------------------------------------------------------------------------ValueError Traceback (most recent call last)<ipython-input-3-ebd3efde9b3e>in<module>8 in_vals_two = np.array([4, 7, 3, 23, 6, 8, 0])9--->10 result = array_operations(in_vals_one, in_vals_two)11 result<ipython-input-3-ebd3efde9b3e>in array_operations(in_arr_one, in_arr_two)1def array_operations(in_arr_one, in_arr_two):2 out_arr = in_arr_one*1.5---->3 out_arr = out_arr + in_arr_two4return out_arr5ValueError: operands could not be broadcast together with shapes (8,) (7,)
Still not working! But we’ve moved on to a different error now. We can still use a print statement to debug this one, which seems to be related to the shapes of variables passed into the function:
in_arr_one shape is (8,)
intermediate out_arr shape is (8,)
in_arr_two shape is (7,)
---------------------------------------------------------------------------ValueError Traceback (most recent call last)<ipython-input-4-4961f476c7eb>in<module>11 in_vals_two = np.array([4, 7, 3, 23, 6, 8, 0])12--->13 result = array_operations(in_vals_one, in_vals_two)14 result<ipython-input-4-4961f476c7eb>in array_operations(in_arr_one, in_arr_two)4print(f'intermediate out_arr shape is {out_arr.shape}')5print(f'in_arr_two shape is {in_arr_two.shape}')---->6 out_arr = out_arr + in_arr_two7return out_arr8ValueError: operands could not be broadcast together with shapes (8,) (7,)
The print statement now tells us the shapes of the arrays as we go through the function. We can see that in the line before the return statement the two arrays that are being combined using the + operator don’t have the same shape, so we’re effectively adding two vectors from two differently dimensioned vector spaces and, understandably, we are being called out on our nonsense. To fix this problem, we would have to ensure that the input arrays are the same shape (it looks like we may have just missed a value from in_vals_two).
print statements are great for a quick bit of debugging and you are likely to want to use them more frequently than any other debugging tool. However, for complex, nested code debugging, they aren’t always very efficient and you will sometimes feel like you are playing battleships in continually refining where they should go until you have pinpointed the actual problem, so they’re far from perfect. Fortunately, there are other tools in the debugging toolbox…
Debugging with the IDE
In this section, we’ll learn about how your Integrated Development Environment, or IDE, can aid you with debugging. While we’ll talk through the use of Visual Studio Code, which is free, directly supports Python, R, and other languages, and is especially rich, many of the features will be present in other IDEs too and the ideas are somewhat general.
To begin debugging using Visual Studio Code, get a script ready, for example script.py, that you’d like to debug. If your script has an error in, a debug run will automatically run into it and stop on the error; alternatively you can click to the left of the line number in your script to create a breakpoint that your code will stop at anyway when in debug mode.
To begin a debug session, click on the play button partially covered by a bug that’s on the left hand ribbon of the VS Code window. It will bring up a menu. Click ‘Run and debug’ and select ‘Python file’. The debugger will now start running the script you had open. When it reaches and error or a breakpoint it will stop.
Why is this useful? Once the code stops, you can hover over any variables and see what’s ‘inside’ them, which is useful for working out what’s going on. Remember, in the examples above, we only saw variables that we asked for. Using the debugger, we can hover over any variable we’re interested in without having to decide ahead of time! We can also see other useful bits of info such as the call stack of functions that have been called, what local (within the current scope) and global (available everywhere) variables have been defined, and we can nominate variables to watch too.
Perhaps you now want to progress the code on from a breakpoint; you can do this too. You’ll see that a menu has appeared with stop, restart, play, and other buttons on it. To skip over the next line of code, use the curved arrow over the dot. To dig in to the next line of code, for example if it’s a function, use the arrow pointing toward a dot. To carry on running the code, use the play button.
This is only really scratching the surface of what you can do with IDE based debugging, but even that surface layer provides lots of really useful tools for finding out what’s going on when your code executes.
Logging is a means of tracking events that happen when software runs. It’s really the best way to debug code. An event is described by a descriptive message that can optionally contain data about variables that are defined as the code is executing.
Logging has two main purposes: to record events of interest, such as an error, and to act as an auditable account of what happened after the fact.
Although Python has a built-in logger, we will see an example of logging using loguru, a package that makes logging a little easier and has some nice settings.
Let’s see how to log a debug message:
from loguru import loggerlogger.debug("Simple logging!")
The default message includes the time, the type of log entry message it is, what bit of code it happened in (including a line number), and the message itself (basically all the info we need). There are different levels of code messages. They are:
CRITICAL
ERROR
WARNING
SUCCESS
INFO
DEBUG
TRACE
You can find advice on what level to use for what message here, but it will depend a bit on what you’re using your logs for.
What we’ve just seen are logging messages written out to the console, which doesn’t persist. This is clearly no good for auditing what happened long after the fact (and it may not be that good for debugging either) so we also need a way to write a log to a file. This snippet of code
logger.add("file_{time}.log")
tells loguru to send your logging messages to a log file instead of to the console. This is really handy for auditing what happened when your code executed long after it ran. You can choose any name for your log file, using “{time}” as part of the string is a shorthand that tells loguru to use the current datetime to name the file.
Log files can become quite numerous and quite large, which you might not want. Those logs from 6 months ago may just be taking up space and not be all that useful, for example. So, what you can also do, is tell loguru to use a new log file. Some examples of this would be logger.add("file_1.log", rotation="500 MB") to clean up a file after it reaches 500 MB in size, rotation="12:00" to refresh the log file at lunch time, and retention="10 days" to keep the file for 10 days.
One further feature that is worth being aware of is the capability to trace what caused errors, including the trace back through functions and modules, and report them in the log. Of course, you can debug these using the console, but sometimes having such complex errors written to a file (in full) can be handy. This example of a full traceback comes from the loguru documentation. The script would have:
logger.add("out.log", backtrace=True, diagnose=True) # Caution, may leak sensitive data if used in productiondef func(a, b):return a / bdef nested(c):try: func(5, c)exceptZeroDivisionError: logger.exception("What?!")nested(0)
while the log file would record:
2018-07-17 01:38:43.975 | ERROR    | __main__:nested:10 - What?!
Traceback (most recent call last):

  File "test.py", line 12, in <module>
    nested(0)
    └ <function nested at 0x7f5c755322f0>

> File "test.py", line 8, in nested
    func(5, c)
    │       └ 0
    └ <function func at 0x7f5c79fc2e18>

  File "test.py", line 4, in func
    return a / b
           │   └ 0
           └ 5

ZeroDivisionError: division by zero
Tests
Note
While this is a slightly more advanced topic, the quality and robustness improvements you will get from writing tests mean it’s still really useful to use the tricks from it.
Tests check that your code is behaving as you expect, even as parts of it change or are updated. They most commonly compare an expected input and output with what actually comes out of your code for a given input.
Writing tests for code is often an after thought for research code, if it’s a thought at all. That’s understandable. But it can really boost reliability and robustness. This excerpt from Research Software Engineering with Python explains why testing even research code is extremely useful:
Why is testing research software important? A successful early career researcher in protein crystallography, Geoffrey Chang, had to retract five published papers—three from the journal Science—because his code had inadvertently flipped two columns of data (Miller 2006). More recently, a simple calculation mistake in a paper by Reinhart and Rogoff contributed to making the financial crash of 2008 even worse for millions of people (Borwein and Bailey 2013). Testing helps to catch errors like these.
The Reinhart and Rogoff paper used Excel for its analysis; while Excel has some pros and does some good in the world, my strong recommendation is that it should not be used for any important analysis.
Back to testing: if you’re writing a package of code for others to use, one that will change and grow over time, tests are essential. These are some general guidelines for good testing, such as:
A testing ‘unit’ should focus on a single bit of functionality;
Each test unit must be fully independent (in practice, this means that setUp() and tearDown() methods need to be defined to prep data or objects to the point where they can be used by the testing unit);
Tests should run fast if possible;
If you know how, it’s a good idea to use something like a ‘Git hook’ that runs tests before code is saved in a shared repository;
If you find a bug in your code, it’s good practice to write a new test that targets it; and
Although long, extremely descriptive names are not very helpful in regular code, they should be used for functions that test code because this is the name you will see when the test fails (and you want to know what it refers to).
The most common way to run tests is to add assertions to code. An assertion is a statement that something must be true at a certain point in a program. When an assertion evaluates to true, nothing happens; if it’s false, the programme stops and prints a user-defined error message. Here’s an example of an assertion:
Putting assertions into code here and there is one way to check that everything is working as you anticipate, but you won’t find out about it until you actually run the code! A testing framework allows you to separate checking the code behaves as you’d expect from running the code, so that you can ensure everything works before putting that big run on.
To run lots of tests, we can use a test framework (also called a test runner). A commonly used test framework is pytest. Essentially it will run anything that you’ve flagged as a test in your code and report back to you on whether it passed or not. Here’s how it works: tests are put in files whose names begin with test_, each test is a function whose name also begins with test_, and these functions use assert statements to check results.
Normally, your functions would be in a different script but here’s an example of a code function and a testing function (that tests it) that you might put in a file called test.py.
# content of test.pydef inc(x):return x +1def test_answer():assert inc(3) ==5
To run this, we would enter
pytest
on the command line. This would yield
=========================== test session starts ============================platform linux -- Python 3.x.y, pytest-6.x.y, py-1.x.y, pluggy-0.x.ycachedir:$PYTHON_PREFIX/.pytest_cacherootdir:$REGENDOC_TMPDIRcollected 1 itemtest.py F [100%]================================= FAILURES =================================_______________________________ test_answer ________________________________def test_answer():> assert inc(3)== 5E assert 4 == 5E + where 4 = inc(3)test_sample.py:6: AssertionError========================= short test summary info ==========================FAILED test.py::test_answer - assert 4 == 5============================ 1 failed in 0.12s =============================
As you add more tests, they will be automatically picked up and run by pytest.
When writing tests, think about whether you have tested realistic combinations of input parameters, tested all discrete outputs at least once, tested the boundaries of continuous outputs, and ensured that informative errors are raised when things go wrong.
If you’re using Visual Studio Code, support for pytest comes built-in.
Testing continuous variables
Imagine we are not testing for an integer, such as 4, but instead for a real number, such as 4.32838. Computers are nothing if not punishingly literal, however, so if evaluation of the code produces 4.32837 instead of 4.32838 the assert statement will fail and the test won’t pass even if the two numbers are close enough for our purposes. It’s even worse than that because computers cannot accurately represent real numbers to arbitrary levels of precision.
To avoid tests that fail even though nothing’s really wrong, most testing packages come with tools for real numbers. Here’s an example where we have a parameter alpha that we’d like to test against an expected value of 1 but with a tolerance of 0.01.
A production-ready code should be heavily tested. Coverage tests ask how much of your code is actually covered by tests and where the code is that isn’t tested. One package to do this is called coverage. If you already have code tests written, you can run:
coverage run -m pytest
on the command line instead of just running pytest. To get a report on the success use
If you would prefer a html report over one in the terminal, use $ coverage html to create a report at htmlcov/index.html.
Timing and profiling
Note
This is a more advanced topic.
Timing and profiling your code are useful to understand where bottlenecks might be. One of the principles of programming is don’t optimise too soon, so, if you are reaching for timing and profiling, you’ve probably already hit that bottleneck.
Note
This section just deals with diagnosing slow code: how to speed code up will be covered elsewhere.
There are different levels of sophistication for timing and profiling. The simplest way to time is to use the built-in library.
If you’re working jupyter notebooks (which is what this book is written in), you can use the timeit magic, a convenient shortcut for timing a line or chunk of code (more on magics, and timeit, here):
%timeit f(0.01)
12.2 ms ± 98.8 μs per loop (mean ± std. dev. of 7 runs, 100 loops each)
timeit will adjust the number of repeats according to how slow the code is to run. Several other magics are available:
%time: Time the execution of a single statement
%timeit: Time repeated execution of a single statement for more accuracy
%prun: Run code with the profiler
%lprun: Run code with the line-by-line profiler
%memit: Measure the memory use of a single statement
%mprun: Run code with the line-by-line memory profiler
Timing is very simple and just tells you the total time of what’s inbetween the start and end points. Often, you would want a bit more detail about what’s being slow, or you may wish to profile an entire script. For that, there’s cProfile, which is a built-in package. You can use it on the command line or within scripts, like this:
What do we get here? The percall columns are tottime and cumtime (respectively) divided by ncalls. tottime is the time spent in the function excluding any sub-functions, while cumtime is the cumulative time spent.
There are various profilers out there that extend the basics provided by cProfile. Let’s look at a few others to get a sense of what extra they offer.
pyinstrument attempts to improve on the standard profilers by recording the ‘entire stack’ of methods so that identifying expensive sub-calls to methods is easier. There are two ways to run it: on the command line, using pyinstrument script.py instead of python script.py, or by wedging the code you’re interested in within a script between a .start() and .stop() method like this:
from pyinstrument import Profilerprofiler = Profiler()profiler.start()def fibonacci(n):if n <0:raiseException("n must be a positive integer")elif n ==1:return0elif n ==2:return1else:return fibonacci(n -1) + fibonacci(n -2)fibonacci(20)profiler.stop()# Print the results of the profiling to screenprint(profiler.output_text(unicode=True, color=True))
Because our function, fibonacci, is nested, the function call breakdown that pyinstrument produces is likewise nested so that you can see how the code calls progresses.
The output analysis can be written to an interactive HTML file too: just use profiler.output_html()
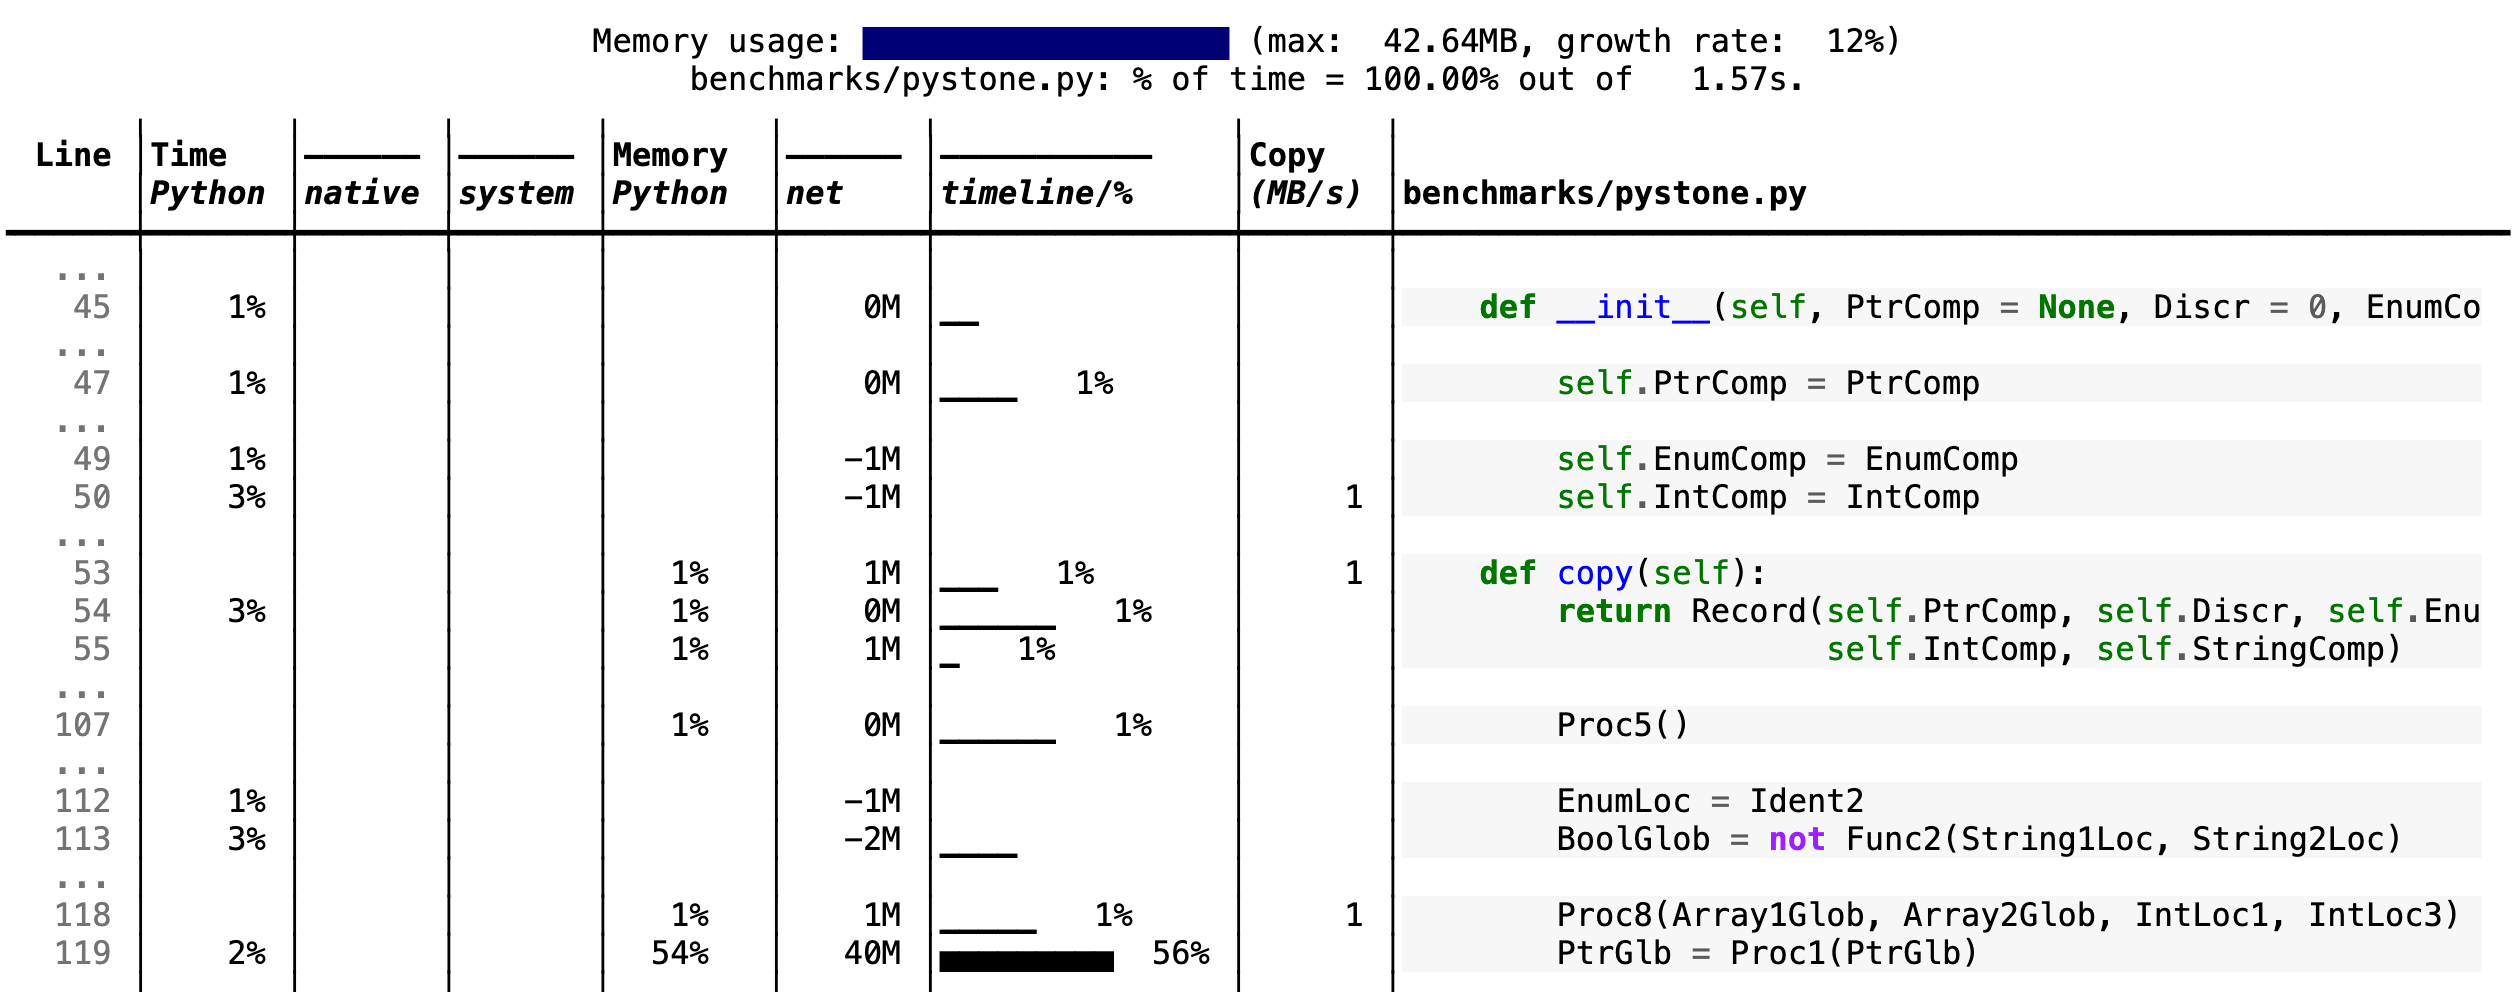
Time to execute code is not the only thing we care about. In fact, for economics applications, it’s much more likely to be a memory bottleneck than a speed one. Operations that involve lots of data, large matrices, or both, might be memory hogs. If you hit the memory (RAM) limit on your machine, it will slow right down and the process that’s running might just crash completely. So wouldn’t it be great it we had a way to profile both code and memory!? Well, we do.
scalene is a command-line utility for profiling code execution time and memory. It profiles whole scripts, run scalene script.py on the command line, and produces HTML reports. Here’s an example of some output:
Screenshot from scalene running on a problem
What’s particularly useful is having the part of the code where the bottleneck is displayed on the right. Memory usage over time tells you where the memory-hogging lines are, while the two CPU % columns tell you how much of the total time (shown at the top) was spent in Python code and in non-Python (‘native’) code, which Python often calls under the hood.