Combining Code and Text in Quarto Markdown
In this chapter, you’ll get more in-depth with Quarto, following a brief introduction in Writing Code. Quarto is a tool that allows you to combine code and text (in the form of markdown, covered in Markdown) and create rich outputs, like reports and presentations. These reports and presentations can also be automated because they are built from code.
Introduction
Quarto is a unified authoring framework for data science, combining your code, its results, and your prose commentary. Quarto allows for outputs that are fully reproducible and it supports dozens of output formats, like PDFs, Microsoft Word files, slideshows, and more.
Quarto markdown is designed to be used in three ways:
For communicating to decision makers, who want to focus on the conclusions, not the code behind the analysis.
For collaborating with other data scientists (including future you!), who are interested in both your conclusions, and how you reached them (i.e. the code).
As an environment in which to do data science, as a modern day lab notebook where you can capture not only what you did, but also what you were thinking.
For example, a use case would be a technical report exploring recent trade statistics in which the code part pulls down the latest data and plots it. Or you could do the same analysis, but push it to a website. Best of all, you can decide whether to hide or show the code parts in the final outputs (or, with html outputs, allow users to choose whether to see the code or not). In more detail, use cases include:
reports that use data and/or charts and that are similar each time they are run (eg only the data are updated)
technical reports that show or use the functionality of an existing code base
slide decks that summarise the most recent data and that are produced at a regular frequency
sending exploratory or prototype analysis to co-authors or collaborators
writing blogs for blogging services that accept
.mdfiles (make sure to export to markdown)creating automatically updated websites relatively easily——we won’t cover that in this chapter, but you can find some information on this here.
Quarto is a really convenient wrapper for a bunch of other tools that makes it convenient to produce automated reports. You should check the latest documentation for an up to date guide on use——here, we’re going to see the basics and introduce a couple of templates that will serve you well.
Prerequisites
You will need to go to the Quarto website and follow the install instructions first. You can check you’ve installed it properly using quarto check install on the command line.
You may also find the Visual Studio Code quarto extension useful and this book recommends it. This creates a special button within Visual Studio code labelled “render” that shows you how the output will look side-by-side with the input.
Automated Reports with Quarto
Quarto can be used to create output documents and slides in a wide variety of formats including HTML, PDF, Microsoft Office (docx and pptx), OpenOffice, and many more.
You can write the input documents (include code snippets) in two possible ways:
A special kind of markdown file, with file extension
.qmd. For more on markdown, see Markdown. Code blocks that have a special syntax get executed and their results are included in any outputs.Jupyter Notebooks, with file extension
.ipynb. Code cells are executed and their results are included in any outputs.
You optionally add code (e.g. Python, R, JavaScript, etc.) to the documents to dynamically create figures, tables, etc. and then render the documents to their final format using Quarto.
A minimal example of a report written with markdown content
We’re now going to try the most minimal example of the first approach, a .qmd file, that also includes code and outputs.
There are advantages and disadvantages to writing your report in the .qmd format. The advantage is that it’s just a plain text file and therefore anyone can open it, look at it, and change it with a text editor (and it’s more convenient for version control in this way too). The big, big disadvantage is that you cannot see how the code is coming on as you write it (you have to render it to see the code outputs, as we’ll see in a moment). In the next sub-section, we’ll see a way of achieving a better workflow.
Let’s get our minimal example setup. The below code and markdown form the content of a file called report.qmd:
---
title: "Example Report"
author: "Joan Robinson"
format: pdf
toc: true
number-sections: true
jupyter: python3
---
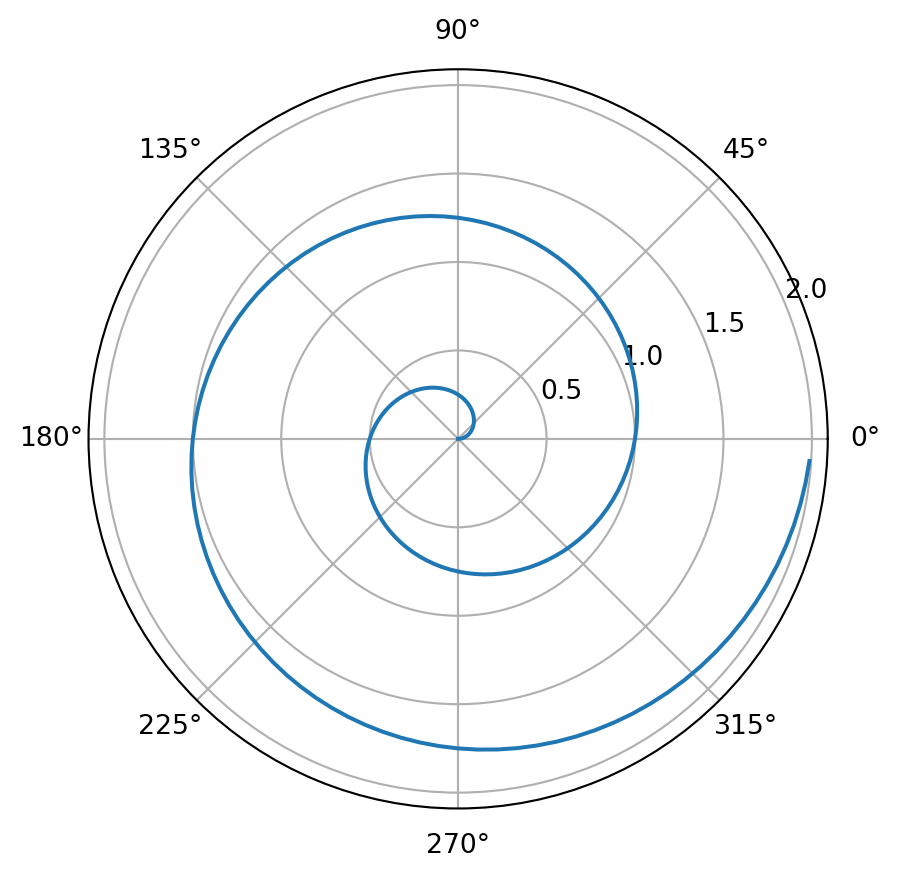
## Polar Axis
For a demonstration of a line plot on a polar axis, see @fig-polar.
::: {#cell-fig-polar .cell execution_count=1}
``` {.python .cell-code}
import numpy as np
import matplotlib.pyplot as plt
r = np.arange(0, 2, 0.01)
theta = 2 * np.pi * r
fig, ax = plt.subplots(subplot_kw={'projection': 'polar'})
ax.plot(theta, r)
ax.set_rticks([0.5, 1, 1.5, 2])
ax.grid(True)
plt.show()
```
::: {.cell-output .cell-output-display}
{#fig-polar width=450 height=439}
:::
:::
This example contains three important types of content:
- A YAML header surrounded by
---s. - Chunks of Python code surrounded by
```. - Markdown mixed with simple text formatting like
# headingand_italics_.
In this ‘raw’ input quarto markdown .qmd file, {python} tells Quarto that a code chunk is in Python and should be executed, and jupyter: python3 tells Quarto what installation of Jupyter Notebooks to use. If you’re unsure what your installation of Jupyter is called, you can see a list by running jupyter kernelspec list on the command line.
Rendering into Output Documents
To turn the above report into an output PDF, save it as report.qmd and then, on the command line and in the same directory as the file, run
quarto render report.qmdRemember that if you are using the Visual Studio Code quarto extension (recommended), you can hit the render button instead (but you’ll need to choose PDF as the output).
Successfuly create a PDF by saving the markdown above into a file called report.qmd.
If you get an error about not being able to find the Jupyter kernel, first check you have Jupyter Lab installed and then check what your Jupyter kernel is called using jupyter kernelspec list on the command line. You need to specify the name of your Jupyter kernel correct in the header document (in the example above, it’s called ‘python3’, which is the default).
Now, because we specified pdf in the ‘header’ of our file we automatically got a pdf. But a wide range of output formats are available. For example, HTML
quarto render report.qmd --to htmland Microsoft Word
quarto render report.qmd --to docxOne slight frustration with the conversion to Word Documents is that tables from code (dataframes) are not rendered as tables in the Word doc.
The basic syntax is to write --to outputformat at the end of the render command.
Successfuly create a HTML report by saving the markdown above into a file called report.qmd and then running the quarto render command with the to html option.
What happens to the menu on the right-hand side as you add extra headings using the ## markdown syntax?
Code Block Execution Options
There are different options for how the code block is executed. To include a code block that doesn’t get executed, just use regular markdown syntax (ie a block that begins ```python). Otherwise, you have rich options about whether to show the input code, just the results, both, or neither (while still executing the code).
For an example of a code output where the input is not shown, the code below will only show the output table by using the echo: false option.
::: {#288611e2 .cell execution_count=2}

::: {.cell-output .cell-output-display execution_count=2}
```{=html}
<div>
<style scoped>
    .dataframe tbody tr th:only-of-type {
        vertical-align: middle;
    }

    .dataframe tbody tr th {
        vertical-align: top;
    }

    .dataframe thead tr th {
        text-align: left;
    }

    .dataframe thead tr:last-of-type th {
        text-align: right;
    }
</style>
<table border="1" class="dataframe">
  <thead>
    <tr>
      <th>island</th>
      <th colspan="2" halign="left">Biscoe</th>
      <th colspan="2" halign="left">Dream</th>
      <th colspan="2" halign="left">Torgersen</th>
      <th>All</th>
    </tr>
    <tr>
      <th>sex</th>
      <th>Female</th>
      <th>Male</th>
      <th>Female</th>
      <th>Male</th>
      <th>Female</th>
      <th>Male</th>
      <th></th>
    </tr>
    <tr>
      <th>species</th>
      <th></th>
      <th></th>
      <th></th>
      <th></th>
      <th></th>
      <th></th>
      <th></th>
    </tr>
  </thead>
  <tbody>
    <tr>
      <th>Adelie</th>
      <td>22</td>
      <td>22</td>
      <td>27</td>
      <td>28</td>
      <td>24</td>
      <td>23</td>
      <td>146</td>
    </tr>
    <tr>
      <th>Chinstrap</th>
      <td>0</td>
      <td>0</td>
      <td>34</td>
      <td>34</td>
      <td>0</td>
      <td>0</td>
      <td>68</td>
    </tr>
    <tr>
      <th>Gentoo</th>
      <td>58</td>
      <td>61</td>
      <td>0</td>
      <td>0</td>
      <td>0</td>
      <td>0</td>
      <td>119</td>
    </tr>
    <tr>
      <th>All</th>
      <td>80</td>
      <td>83</td>
      <td>61</td>
      <td>62</td>
      <td>24</td>
      <td>23</td>
      <td>333</td>
    </tr>
  </tbody>
</table>
</div>
```
:::
:::
The table below gives all of the options for code blocks.
| Option | Description |
|---|---|
eval |
Evaluate the code chunk (if false, just echos the code into the output). |
echo |
Include the source code in output |
output |
Include the results of executing the code in the output (true, false, or asis to indicate that the output is raw markdown and should not have any of Quarto’s standard enclosing markdown). |
warning |
Include warnings in the output. |
error |
Include errors in the output (note that this implies that errors executing code will not halt processing of the document). |
include |
Catch all for preventing any output (code or results) from being included (e.g. include: false suppresses all output from the code block). |
true |
True |
false |
False |
It’s also possible to insert code results in-line with text. Here’s a minimal example of that.
---
title: "Example Report with Inline Numbers from Code"
author: "Joan Robinson"
format: pdf
toc: true
number-sections: true
jupyter: python3
---

## Report

For a demonstration of a line plot on a polar axis, see @fig-polar.

For an example of a code output where the input is not shown, the code below will *only* show the output table by using the `echo: false` option.


### The Heaviest Penguin

We find that the heaviest penguin, out of a total of `python f"{number}"` penguins, has a mass of `python f"{big_pen:.2f}"` kilograms.
Note that, in this example, the :2f part of {big_pen:.2f} is an instruction to report the given number to 2 decimal places.
Create a HTML report with an in-line number using the above example but change the formatting of the heaviest penguin to not show any decimal places.
There are, of course, lots of extra features that go beyond this example.
A minimal example of a report written with Jupyter Notebooks
You can also write your reports with Jupyter Notebooks. As a reminder, these have cells that can be either text (in the form of markdown) or code (and they support a lot of languages), and have the file format .ipynb. This book recommends working with them in Visual Studio Code. Google Colab notebooks are a type of Jupyter notebook (and can be downloaded as .ipynb files).
Writing your automated reports in Jupyter Notebooks has one major advantage over using .qmd markdown files: you can run the code as you go, so you know what you’re getting and it’s easier to weed out bugs. This book recommends this approach to writing automated reports.
So what is the difference from what we’ve seen above? Very little, actually. Your content will still start with exactly the same header but this time it’s going to be in a markdown cell at the top of your notebook. To be explicit, the first cell in your notebook will have:
---
title: "Example Report"
author: "Joan Robinson"
format: pdf
toc: true
number-sections: true
jupyter: python3
---
Subsequent cells will be code or markdown depending on whether you need rich outputs (figures and tables) or text. So, instead of a code chunk that begins with ```{python} like in the .qmd approach, you will just create a new code cell.
Remember that putting format: pdf into this header will mean that the render command automatically produces a pdf. You can change it to format: html to default to a html file instead—and both options can be over-written by passing --to format.
As before, you can create text that is dynamically updated with code outputs too; just choose a code cell rather than a markdown cell.
The main difference when it comes to Jupyter Notebooks is that you must decide whether you want to execute the notebook before you render it with Quarto. Executing a notebook just means run the code before exporting it to a new format. (As an aside, the best practice way to use Jupyter Notebooks is to save them without any code outputs, so execute and render would be the standard way of doing it.) The terminal command to run a notebook and render it is:
quarto render jupyter-report.ipynb --executeCreate a new Jupyter Notebook called jupyter-report.ipynb with the header above. Re-use the blocks of code and text from the qmd example in the previous section. Render it with the command above.
To change the output type, add another instruction to the command using --to:
quarto render jupyter-report.ipynb --execute --to htmlThe Optimal Workflow for Writing Automated Reports
This is an alternative to using the Visual Studio Code Quarto extension.
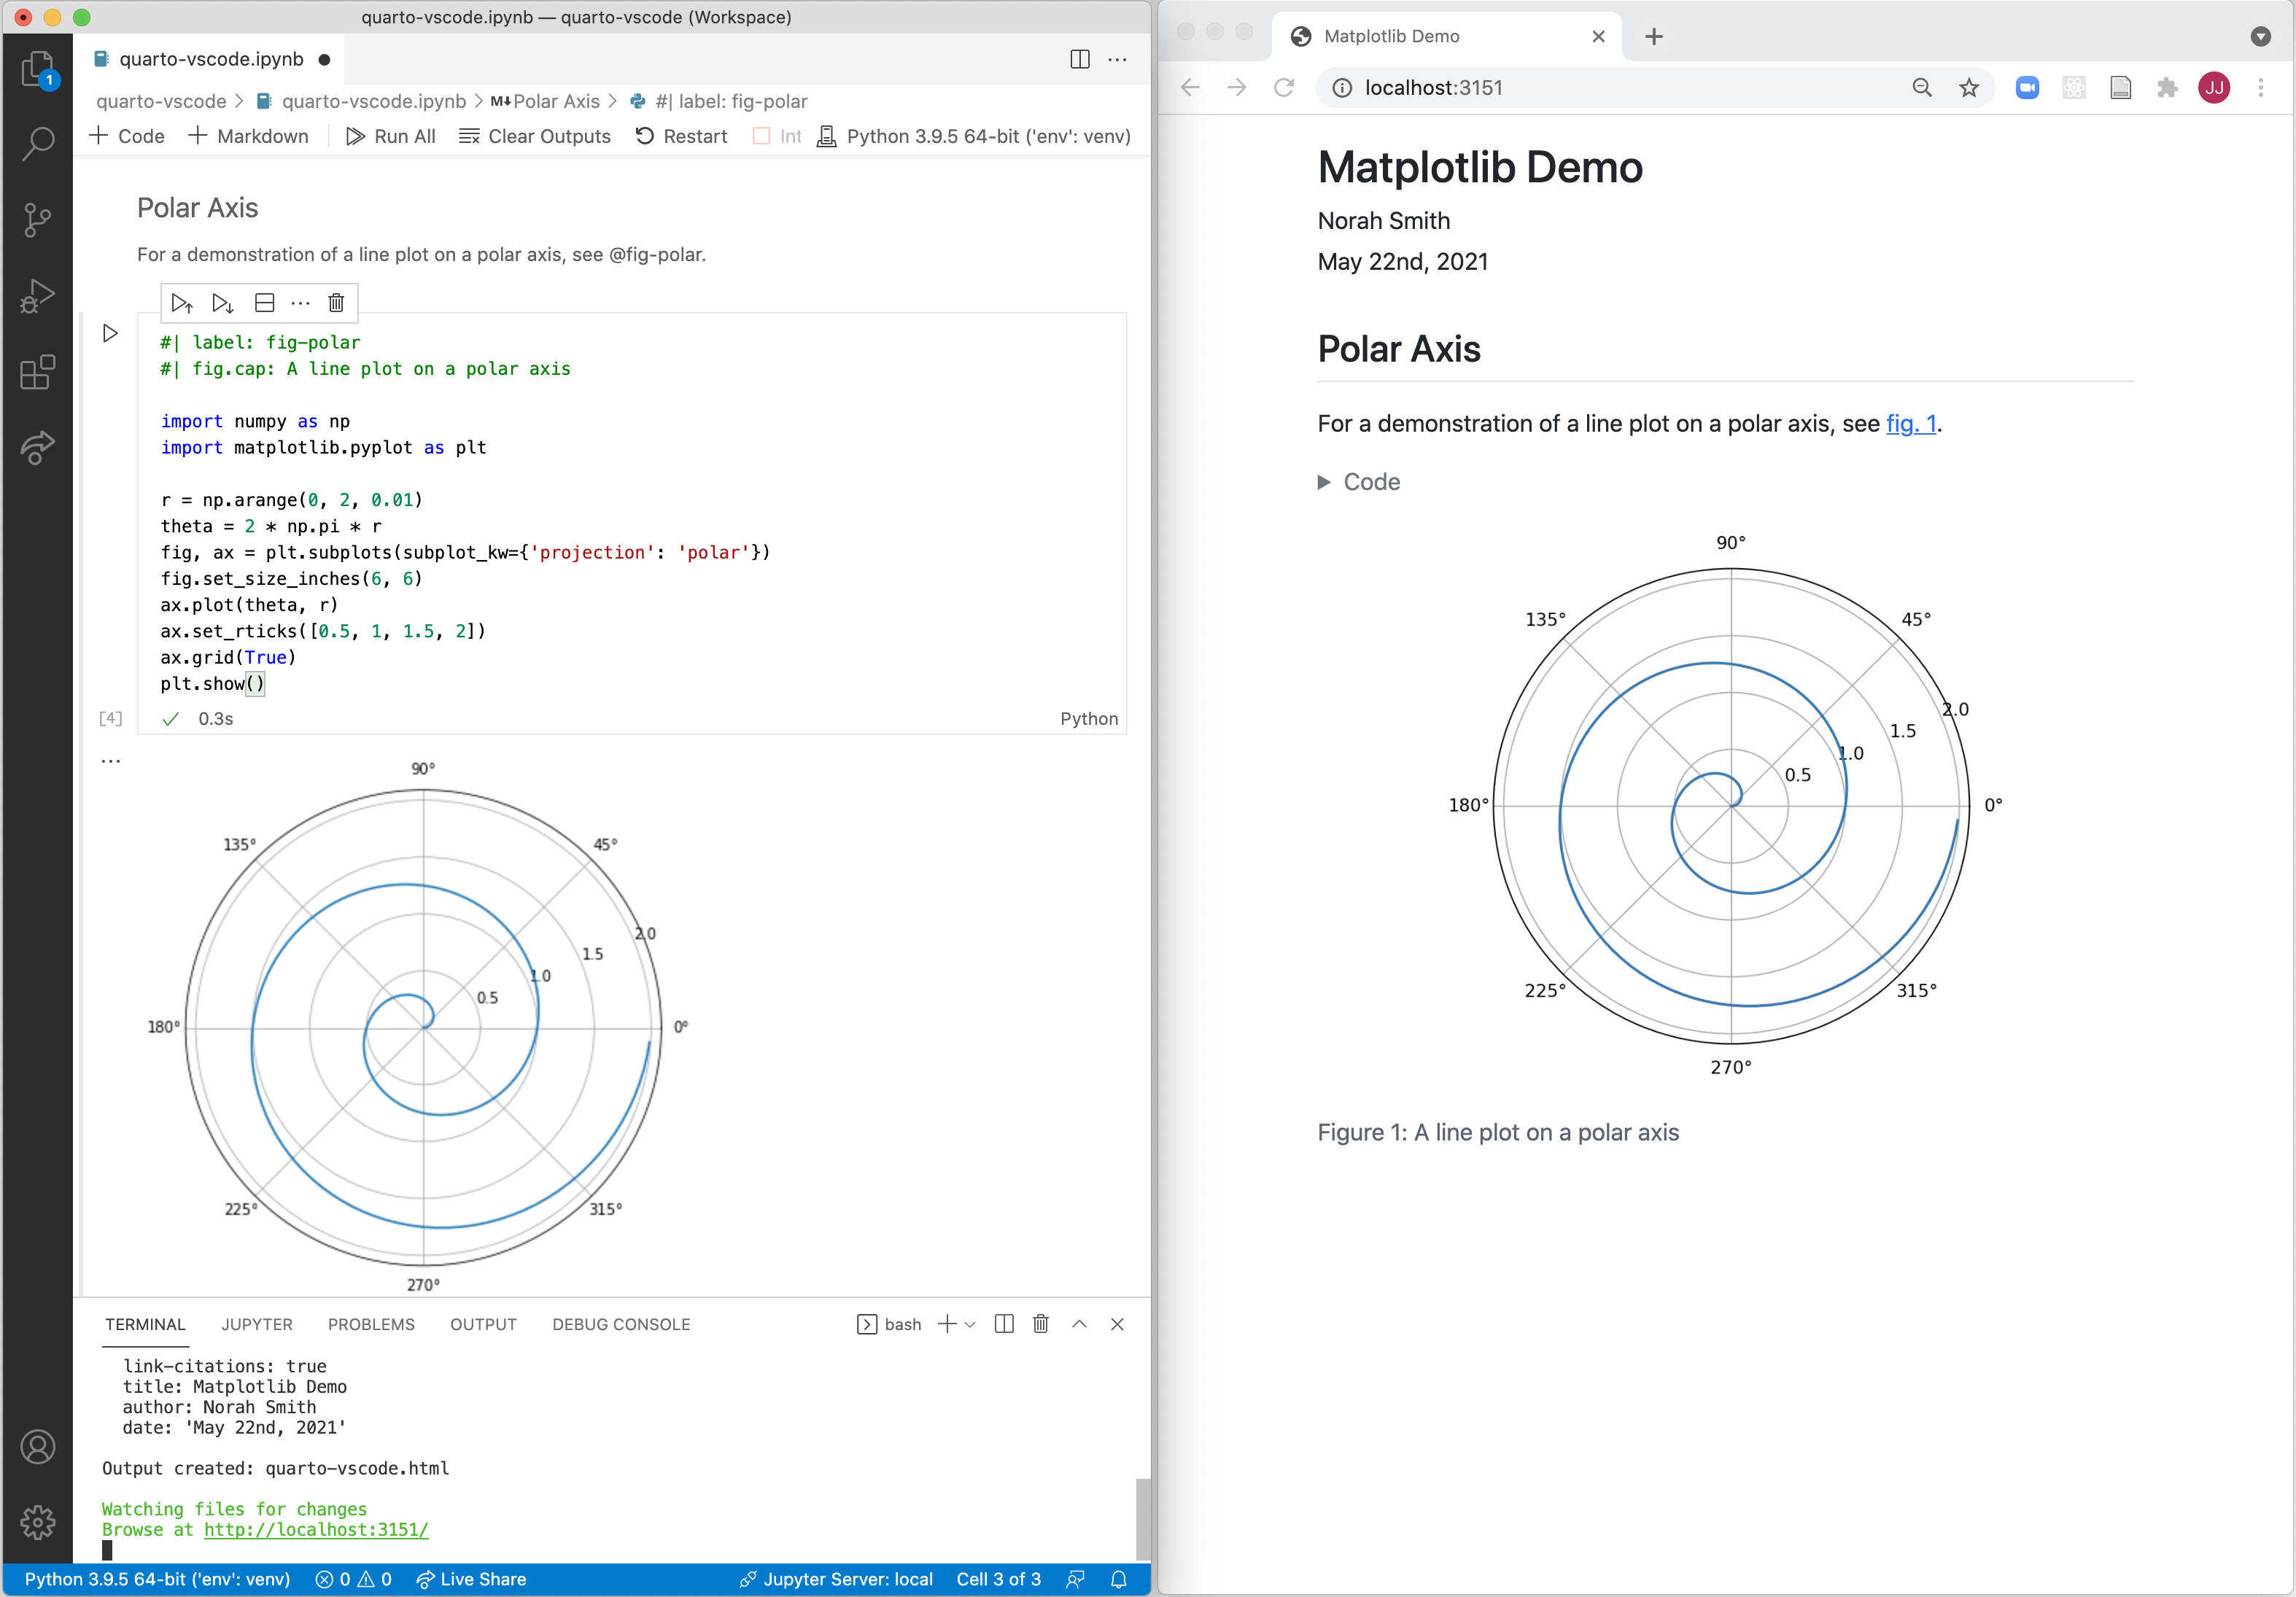
We now turn to a big tip on the optimal workflow for making automated reports and slides. Often you are interested in seeing how the final report will look as you change the code in real time. This is possible with Jupyter Notebooks and Quarto. Run the following in the terminal
quarto preview jupyter-report.ipynbA browser window will open with a live preview of your pdf (if you set pdf as the default output option in the header). To create a live preview of a HTML document, it’s
quarto preview jupyter-report.ipynb --to htmlThe image below shows an example of using preview side-by-side with a Jupyter Notebook in Visual Studio Code.
Take the Jupyter example from the previous exercise and change the format to HTML. Then add both a new text cell and a new figure (from a code cell) while in preview mode, making use of the quarto preview command above. If you need inspiration for the new figure, here’s a simple scatter plot:
import numpy as np
import matplotlib.pyplot as plt
fig, ax = plt.subplots()
ax.scatter(
    [1, 2, 3, 4, 5, 6],
    [1, 4, 2, 3, 1, 7],
    s=np.linspace(300, 2000, 6),
    c=["b", "r", "g", "k", "cyan", "yellow"],
    edgecolors="k",
    alpha=0.5,
)
plt.show()
Automated Slides with Quarto
It isn’t just reports that you can create; you can make slide decks too. You have three main output formats to choose from for slides:
- html, via something called ‘revealjs’; use
format: revealjs - pdf, via the LaTeX beamer package; use
format: beamer - Powerpoint, using the pptx format; use
format: pptx
Everything else is the same as we have seen before. Here’s a minimal example showing both code and text. It creates a HTML slide deck.
---
title: "My Talk"
author: "Joan Robinson"
format: revealjs
---
## Introduction
- This is some text
- As is this
## Here Are Some Code Outputs
::: {#962d3464 .cell execution_count=4}
::: {.cell-output .cell-output-display}
{width=450 height=439}
:::
:::
Note that this will not show the code, only the figure, as we have set #| echo: false for the code chunk. You could also set echo: false for the whole deck in the header.
Render this slide example in all three of the main formats
Add outputs from in-line code into your rendered deck, adapting the heaviest penguin example from earlier.
Tips for research papers and slides
If you wish to auto-insert latex tables into a PDF paper or slides generated by Quarto, you can absolutely do it. This is nice because it means that whenever you refresh your project’s outputs they are automatically scooped straigt into your paper. This could be, say, a regression table in latex from your usual regression package.
We have found that the arxiv-pdf extension for papers produces good results. Once you’ve installed that, you might have a header that looks like this:
---
title: "The title of my paper"
format:
  arxiv-pdf:
    keep-tex: true
    linenumbers: false
    doublespacing: false
    runninghead: ""
    fig-pos: H
    include-in-header:
      - text: |
          \usepackage[utf8]{inputenc}
          \usepackage{fontspec}
          \usepackage{booktabs}
          \usepackage{makecell}
          \usepackage{threeparttable}
          \usepackage{amsfonts}
          \usepackage{amssymb}
          \usepackage{amsmath}
          \usepackage{amsthm}
  arxiv-html: default
author:
  - name: Your name
    affiliations:
      - name: Fake University
        department: Fake University
        address: 1 Forestry Drive
        city: Durham
        country: UK
        postal-code: DH1 3LJ
    orcid: 0000-0000-0000-0000
    email: fake_email@fakeyfake.com
    url: https://www.yourwebsitehere.co.uk
abstract: |
  Abstract here.
keywords:
  - keyword1
  - keyword2
  - keyword3
bibliography: bibliography.bib
csl: chicago-author-date.csl
link-citations: true
execute:
  echo: false
jupyter: python3
---
Note that this keeps a .tex version of your paper. To avoid duplication of what’s under version control, you might want to add the .tex file to your .gitignore file. You will need to have separate .csl and .bib files.
Including in-line numbers and even text
Let’s say you’re writing a results paragraph describing a number in the text—you can auto-update this! And you can do it for text too—which would be useful if you were changing an overall configuration, say going from rolling window to expanding window in a forecast model.
```{python}
... code that reads in the number and stores it as a variable `result` ...
... code that reads in the text config and stores it as, eg, `window_type="rolling"`
```
We find that this happens in python f"{result}" cases when we use a python window_type window forecasting model.
### Including latex tables

In your code, you might have something like:

```{python}
tab_one_latex = (
    proto_table.style.format(subset="Mean (daily)", precision=3)
    .format(subset="Std dev (daily)", precision=2)
    .format(subset="Total", precision=0)
    .to_latex(hrules=True)
    )

with open(Path("outputs/table_one.tex"), "w") as f:
    f.write(tab_one_latex)
```
to export a (pandas dataframe) table called proto_table.
And then in your Quarto file you would have:
```{python}
#| label: tbl-one
#| tbl-cap: Summary statistics
#| output: asis
#| echo: false
#| tbl-pos: H

with open(Path("outputs/table_one.tex"), "r") as f:
    tab_one = f.read()

print(tab_one)
```
You can refer to this table in the rest of the document using Summary statisticsa are shown in @tbl-one.
Including figures generated elsewhere
Include figures using, eg, the following:
{#fig-one}and reference this as usual with @fig-one.
You can also automatically write out the packages you used in the paper (if you’re using pyproject.toml file):
# Appendix {.unnumbered}

## Software {.unnumbered}

This paper was prepared using Quarto and Python 3.10. The packages used are shown in @tbl-pkg.

```{python}
#| label: tbl-pkg
#| tbl-cap: Packages used in this paper.
#| output: asis
#| echo: false
#| tbl-pos: h


with open("pyproject.toml", "rb") as f:
    packages_toml = tomli.load(f)

pkg_df = pd.DataFrame(packages_toml["project"]["dependencies"])
pkg_df = pkg_df[0].str.split(">=", expand=True)
pkg_df = pkg_df.rename(columns={0: "Python package name", 1: "Version"})
pkg_df = pkg_df.set_index("Python package name")
pkg_df
```

# References {.unnumbered}

::: {{#refs}}
:::